Manufacturing

AI video analytics for manufacturing: a live record of how work gets done on your floor

Agnify runs AI video analytics on the existing cameras in your plant, plus a camera over any station that needs one. It measures machine uptime and downtime, cycle time by station, missed assembly steps and material moving through the plant, by shift, line and site, without a clipboard.

See it on a real line: production, uptime and the operator, from one camera →
Works with the cameras you already have Activity by station and role, never by identity Dashboards, alerts and an API that sit alongside your MES

One ceiling camera counts every bag and times every stop on a real press line

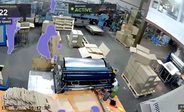
Real footage from a hand-fed paper-bag press. Every overlay is model output: people masked, every bag counted, running and stopped time, and an alert when the operator walks away.

Real footage, model output. 33 seconds cut from a 1 minute 51 second run; the printing stretch plays at 6x speed.
Bags counted33 of 33Every bag in this clip; 60 of 61 over the full recording.
Running time0:57 of 1:51The press feeds a bag every 1.65 seconds, so a 5-second gap means it has stopped. No extra model needed.
Nobody at the station6.5 sFrom the operator walking away to the alert.
People maskedEvery frameA solid mask over every person before anything else runs.

Measured, not claimed. Counts were scored against a tape mark on the press cylinder that passes the camera once per bag. Open the interactive example →

Most of what happens on the floor never becomes data

PLCs see the machines that are wired up. Your MES sees the scans. Everything in between is written down at the end of the shift, if at all. Cameras already see all of it.
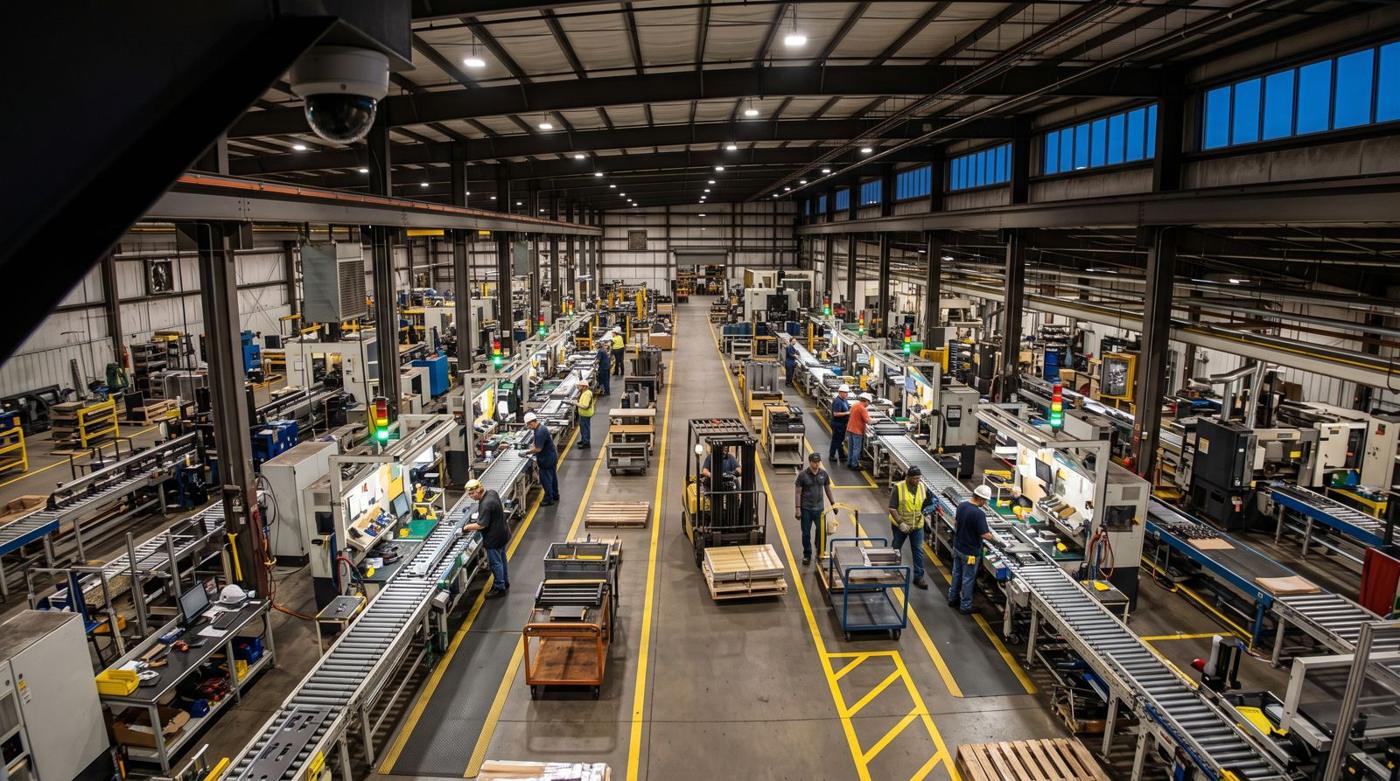
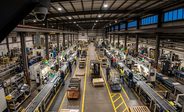
A large production floor seen from a corner camera, with assembly lines, workers at stations and a forklift in the main aisle
CAM-04 · Hall B · assembly lines 1 to 4Example site

Stops without a reason

Downtime is logged from memory, and manual logs are "often highly inaccurate." Short stops disappear from the record altogether.4

See machine downtime

Manual steps without a sensor

Nothing records the bolt, the connector or the label that a person fits by hand, until a unit fails later.

See step checks

Labor without a picture

The staffing plan says one thing. The floor says another, and walking, waiting and searching never show up anywhere.

See labor by station

Material between scans

A pallet is scanned in and scanned out. How long it waited, and where, stays invisible.

See material flow
01 · EQUIPMENT

Machine downtime tracking with the clip for every stop

Each machine is tracked as running, idle or down, read from the stack light, the door, the spindle or the parts coming out. That works on older machines with no data connection too. Every stop gets a start, an end, a duration and the clip, so the reason comes from a look at the clip, not a guess.
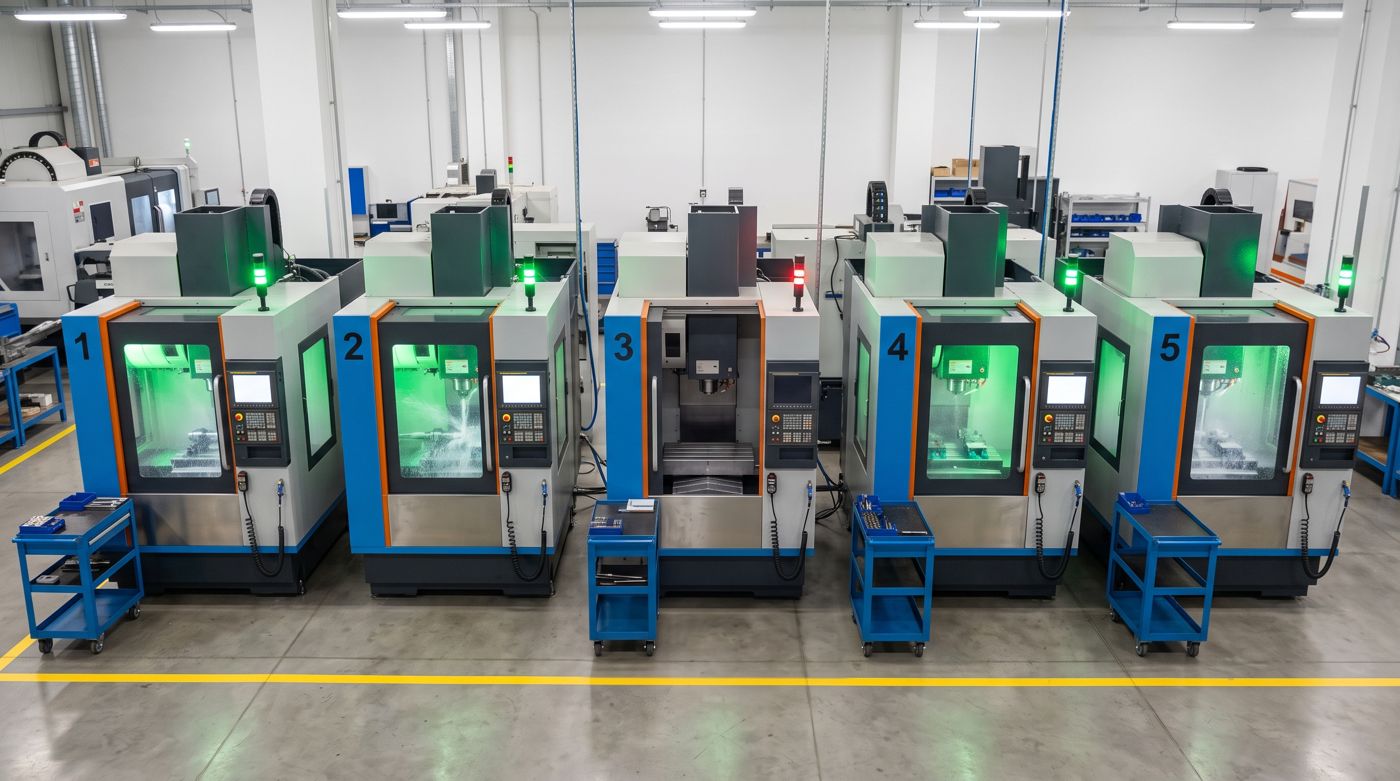
Five identical CNC machining centers in a row; machine 3 has a red stack light and its door open
CAM-11 · Machining cell A10:42
Machining cell A · shift 1Machine states since 06:00 · example data
1 down
Cell uptime this shift84%
RunningIdleDown
    Downtime with the clipPlanned or unplanned, changeover, waiting on material, waiting on maintenance. The reason is picked from the footage.
    The short stops tooTwo-minute stops that nobody writes down, counted and totaled by machine and shift.
    Response timeFrom the moment a machine stops to the moment a technician arrives, and on to the restart.
    02 · PROCESS

    Assembly step verification at every station, before the unit moves on

    A camera over each station confirms the step happened before the unit moves on: part present, fastened, guard fitted, label on. Missed and out-of-order steps are flagged at the station, not at final inspection. The same cameras measure cycle time by station, so you can see where the line is constrained.
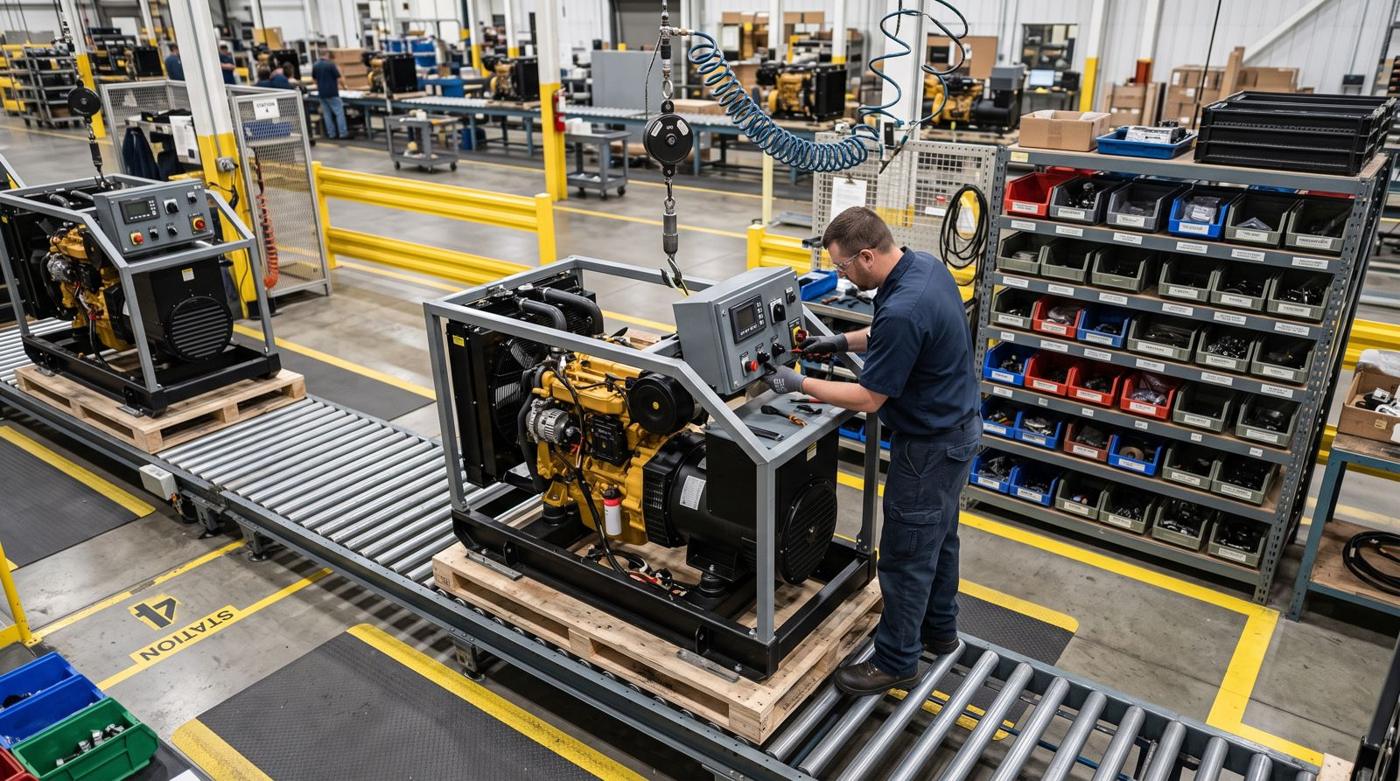
    Station 4 on a generator assembly line: an operator fits the control panel onto a generator set on a conveyor pallet, next to a rack of parts bins
    CAM-S4 · Generator line · station 4, panel and wiring14:07
    Unit GS-2291 · station 4Panel and wiring · standard work, 5 steps · example data
    Hold at station

      Cycle time by station against takt

      Median minutes per unit · generator line · last 20 units · example data

      Station 3 is the constraint: over takt on 14 of the last 20 units. Hover a bar for details.
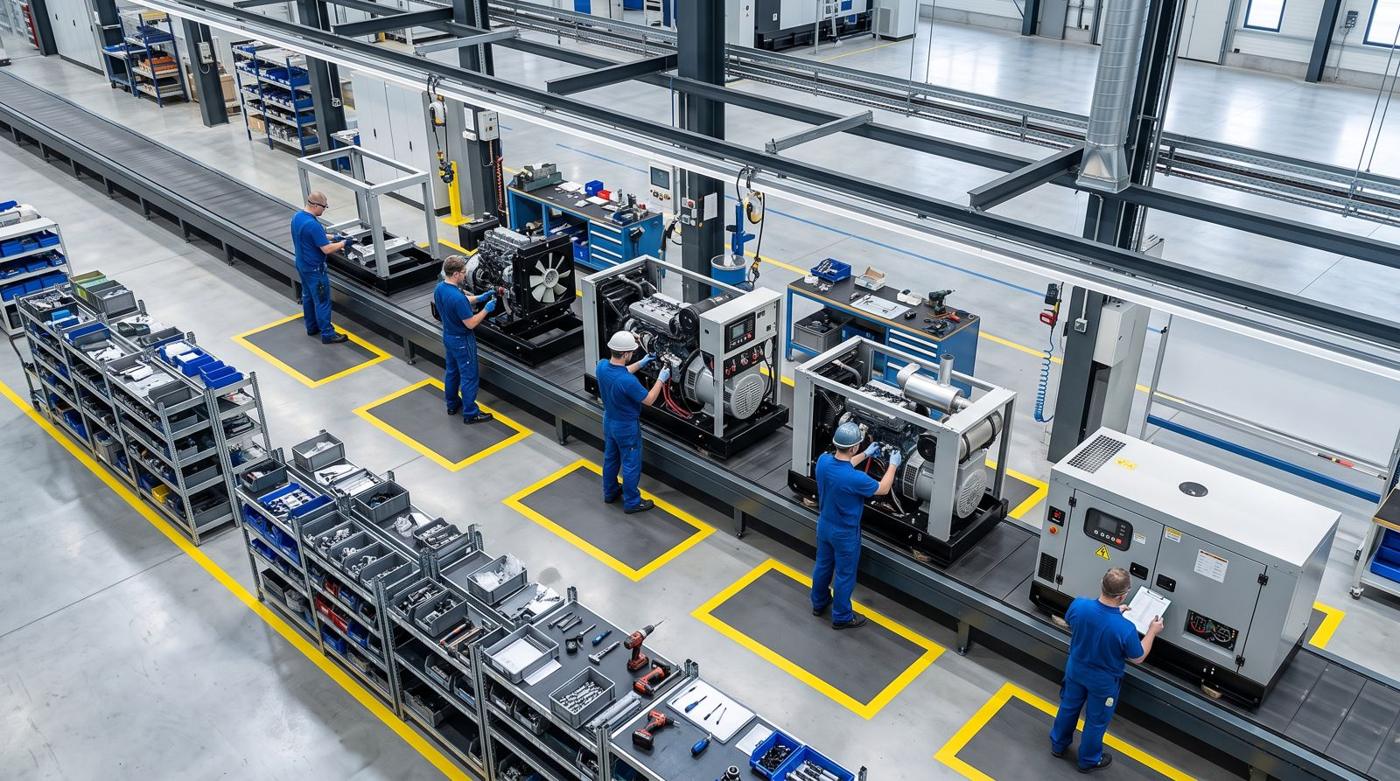
      Overhead view of a generator assembly line with five stations, each unit at a later stage of assembly
      Caught at the stationIn a Sandia study, trained inspectors caught 85% of defective parts.5 Checking each step as it happens stops the misses from reaching final inspection.
      Stage timingTime in each stage for every unit, from frame load to pack-out, with the stations that hold the line up.
      Traceable unitsEach unit's steps, times and clips kept together, ready for a customer query or a warranty claim.
      03 · PEOPLE

      Station utilization: where labor hours go, by station and role

      Agnify shows which stations are staffed or empty, time spent working versus waiting, headcount by area against plan, and the walking and searching that never makes it into a time study. With up to 1.9 million US manufacturing jobs at risk of going unfilled by 2033, every staffed hour counts.6 It's built to help teams balance work, not to watch individuals.
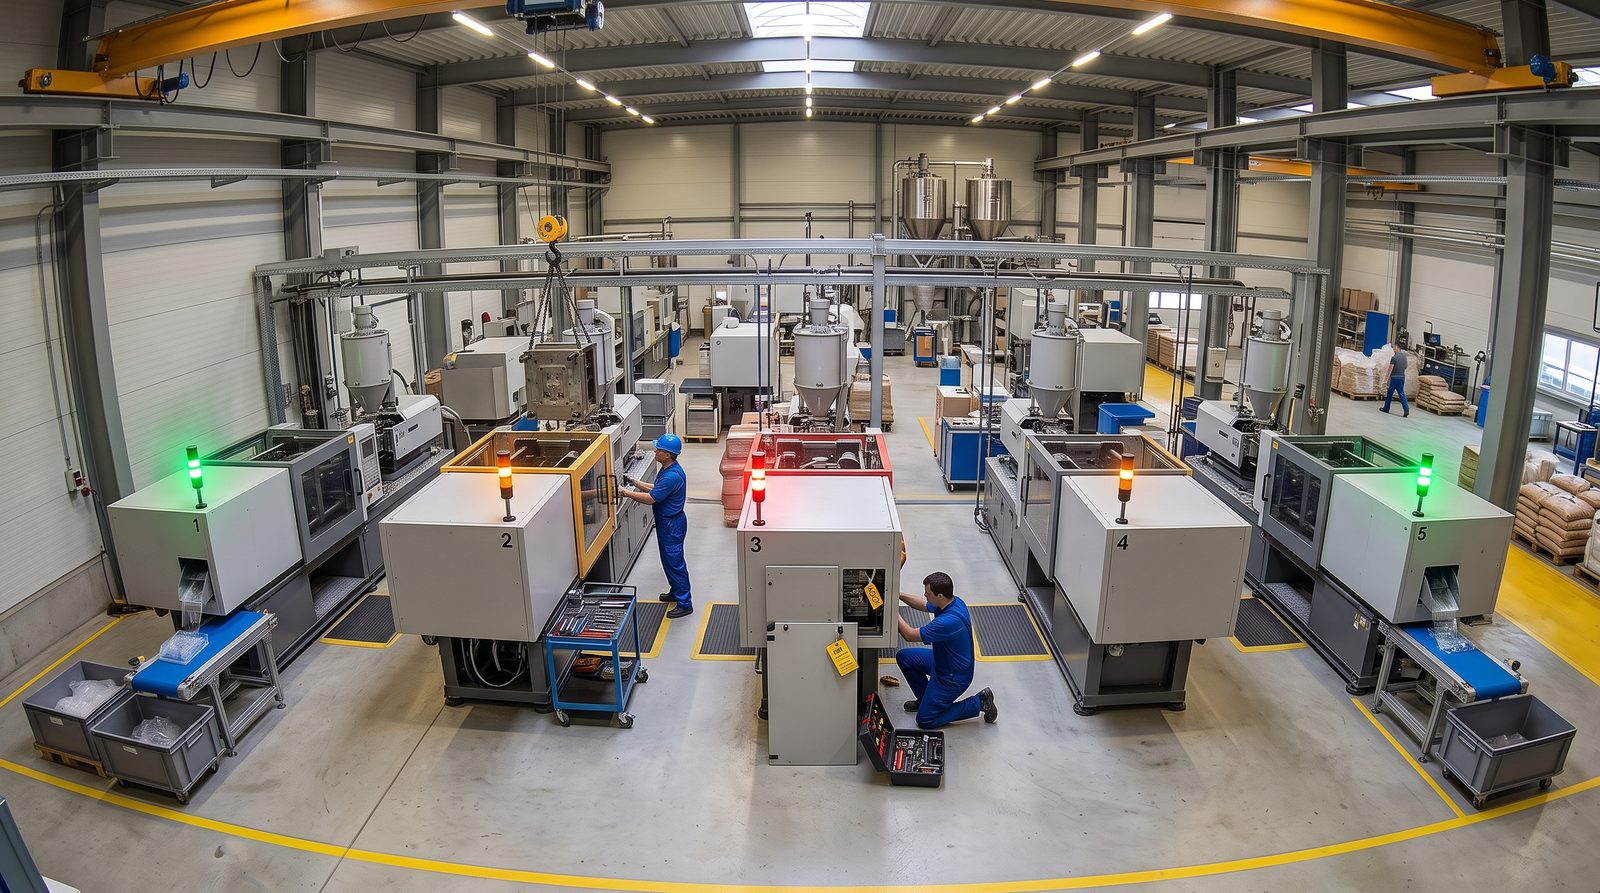
      A molding cell with five presses, an operator at press 2 and a technician kneeling at stopped press 3
      CAM-M2 · Molding cell · overheadExample boxes

      Time at each station, shift 1

      Share of staffed time · example data

      WorkingWaitingWalking or searching

      Activity, not identity. Agnify reports by station, zone, role and shift. It uses no facial recognition, whole-person blur can be switched on for video outputs, and retention is set to the shortest period the purpose needs. We help you brief your teams and, where one exists, the works council or union before anything goes live.

      04 · MATERIAL

      WIP tracking: where material waits, from dock to dock

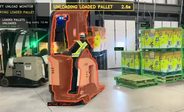
      Follow pallets, carts and WIP from receiving through production to shipping. You'll see where work in progress piles up, how long it waits between stations, which dock doors are busy and how forklifts spend their time. A plant's flow map, drawn from what really happened.
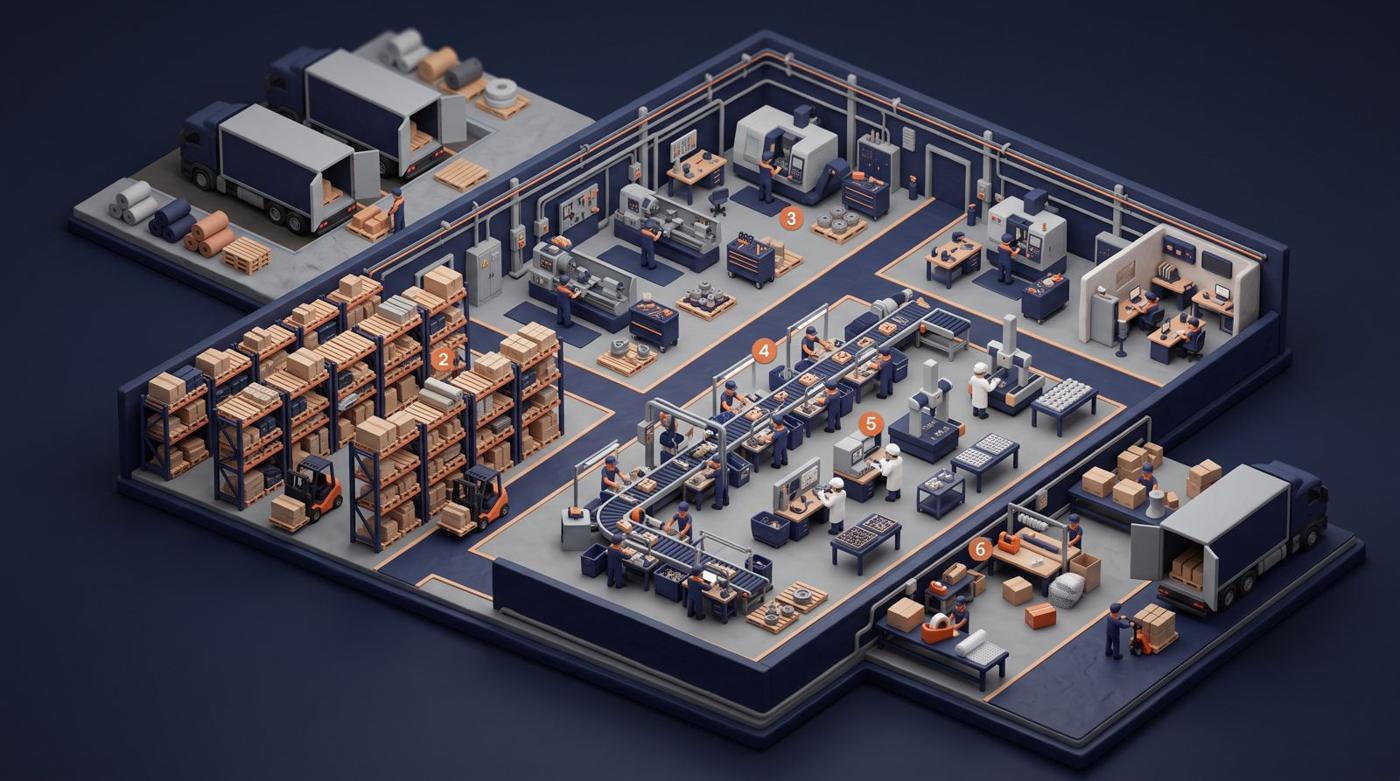
      Isometric cutaway of a manufacturing facility with receiving, storage, production lines, staging and shipping areas

      Where a pallet's time goes

      Receiving to shipping, median, last 7 days · example data

      Value-added time is the small slice. The rest is waiting, and waiting is where the space and cash go.

      WIP and dwellCounts in each staging square and the time since each pallet arrived, with queues flagged before the next station starves.
      Docks and trailersDoor occupancy, trailer dwell and loading time, set against the ship schedule.
      Forklifts and tuggersLoaded versus empty travel, idle time and the busiest routes.
      05 · OEE AND IMPROVEMENT

      OEE tracking with the clip behind every loss

      Availability comes from real stop times, performance from counted cycles and quality from rejects seen at the station. OEE per line and shift, broken into the losses your daily meeting can act on, and questions answered in plain English: "When did line 3 stop yesterday, and why?" Manufacturers investing in smart manufacturing report 10–15% of capacity unlocked.7

      Line 2 · shift 1 · where the 7.5 planned hours went

      Example data

        80%Availability
        85%Performance
        96%Quality
        65%OEE
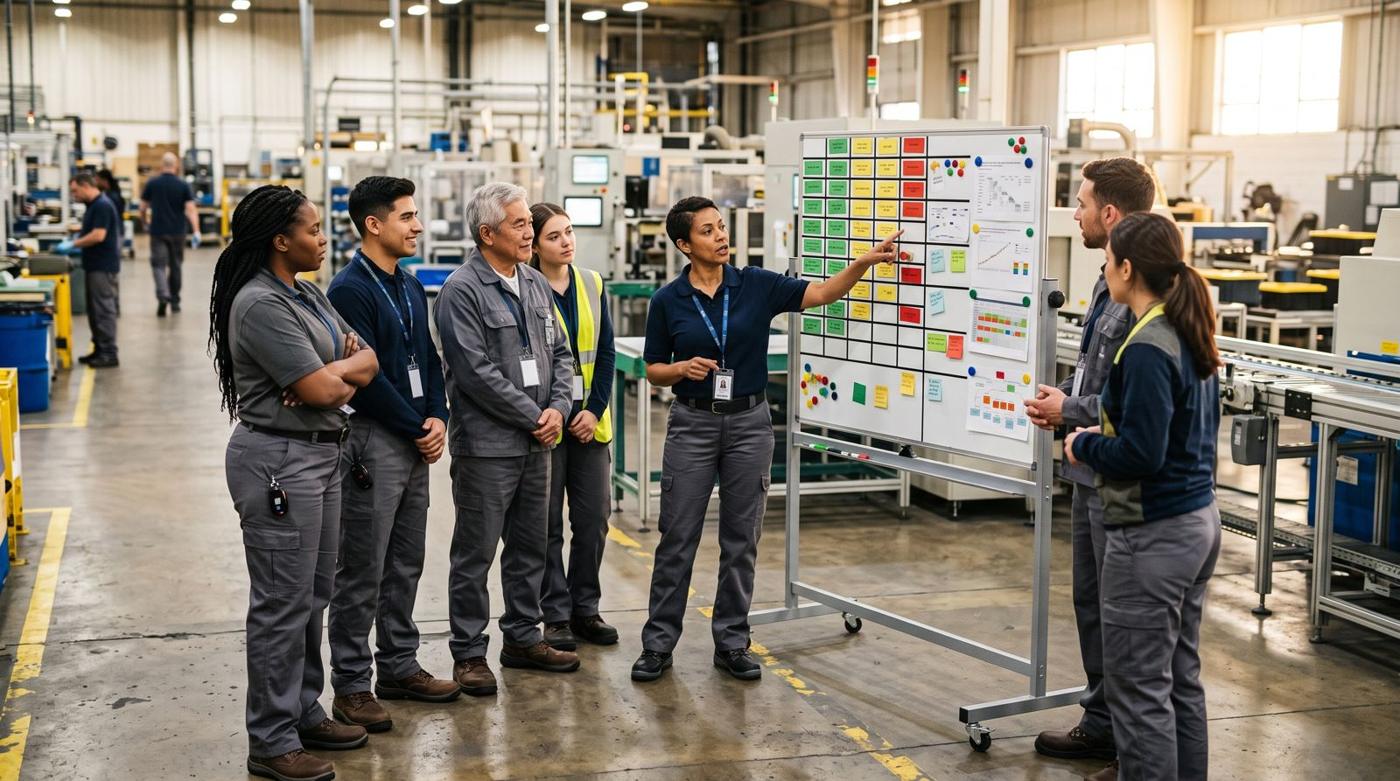
        A supervisor and operators at a start-of-shift huddle around a tier board on the factory floor

        What a few points of OEE are worth on your line

        With the same planned hours and product mix, good output rises in proportion to OEE. Put in your own numbers.

        Illustrative arithmetic, not a measured or guaranteed result. Assumes this line is the plant's constraint, with the same product mix, ideal cycle time and planned hours. Added capacity becomes revenue only where there's demand; otherwise it's the same volume in fewer hours.

        +10%More good output from the same planned hours
        $5.0MAdded capacity a year, where there's demand
        545 hPlanned hours a year freed up if you make the same volume instead

        What Agnify measures on assembly, machining, process and dock floors

        Agnify is built around what operations teams measure, not around one industry.
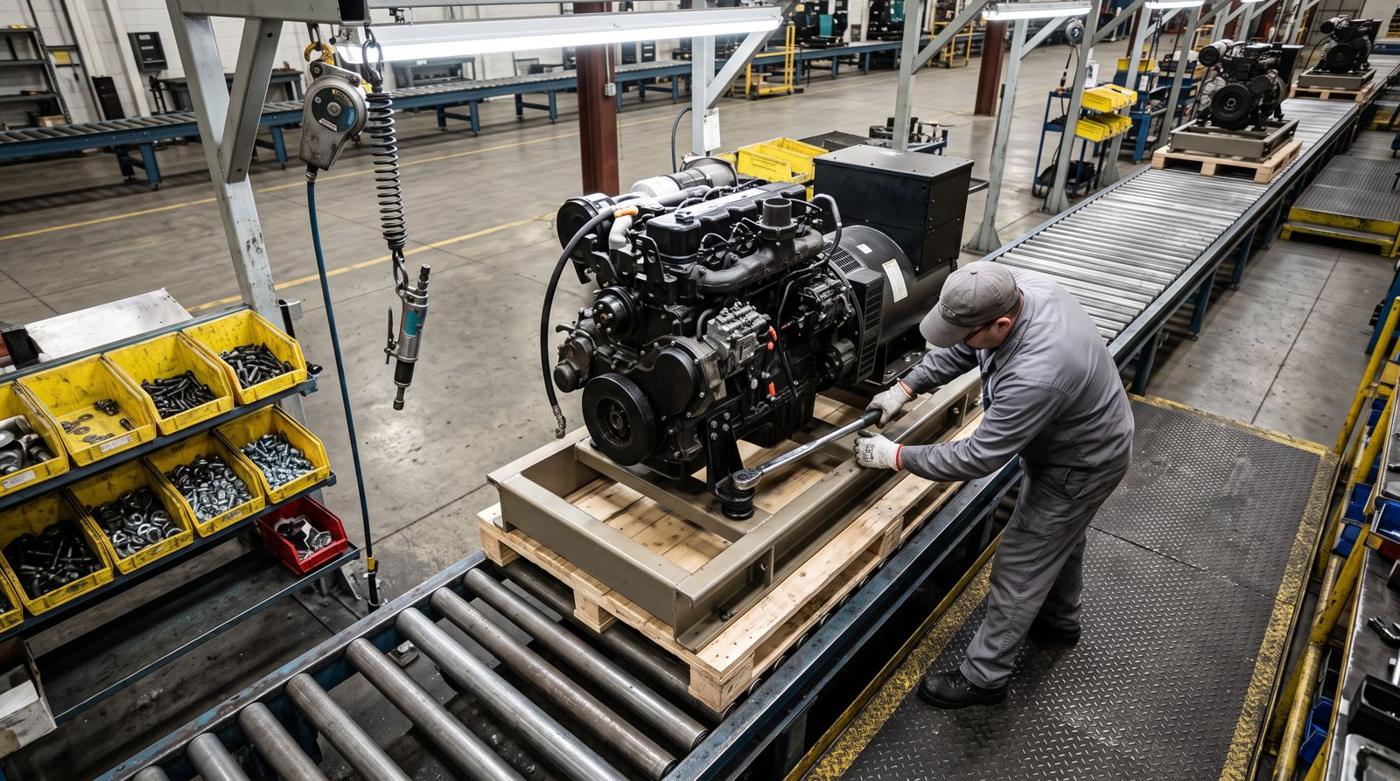
        A worker fastening engine mounts on a generator set on a roller conveyor

        Assembly lines

        • Step checks at each station
        • Cycle time against takt
        • Stations staffed or empty
        • Rework loop and first-pass yield
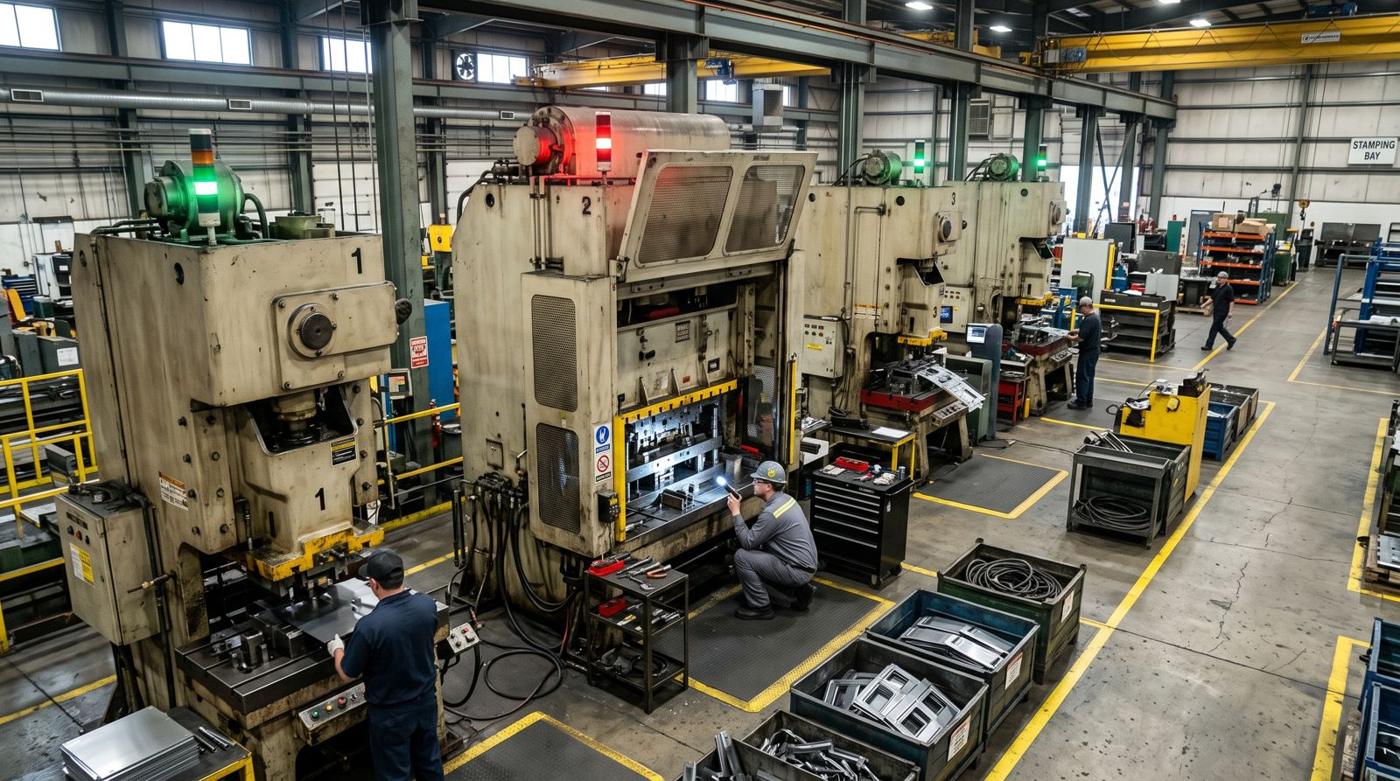
        A line of stamping presses; one is stopped with a red stack light and a technician inside

        Machining and fabrication

        • Machine running, idle or down
        • Changeover time
        • Maintenance response
        • Parts out per hour
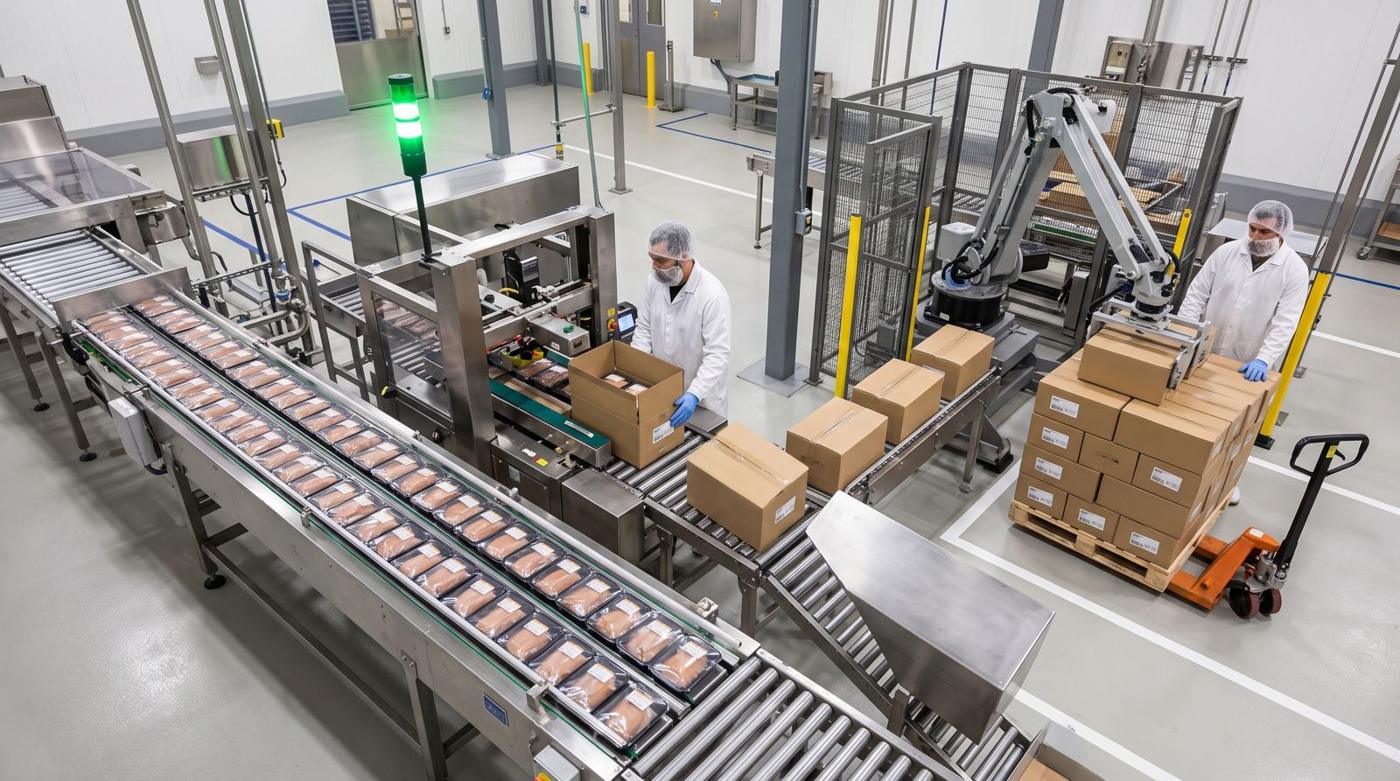
        A food packaging line with trays moving into a case packer and workers in white coats

        Food, beverage and process

        • Line stops, jams and starved fillers
        • Batch and stage timing
        • Changeover and sanitation time
        • Cases and pallets counted
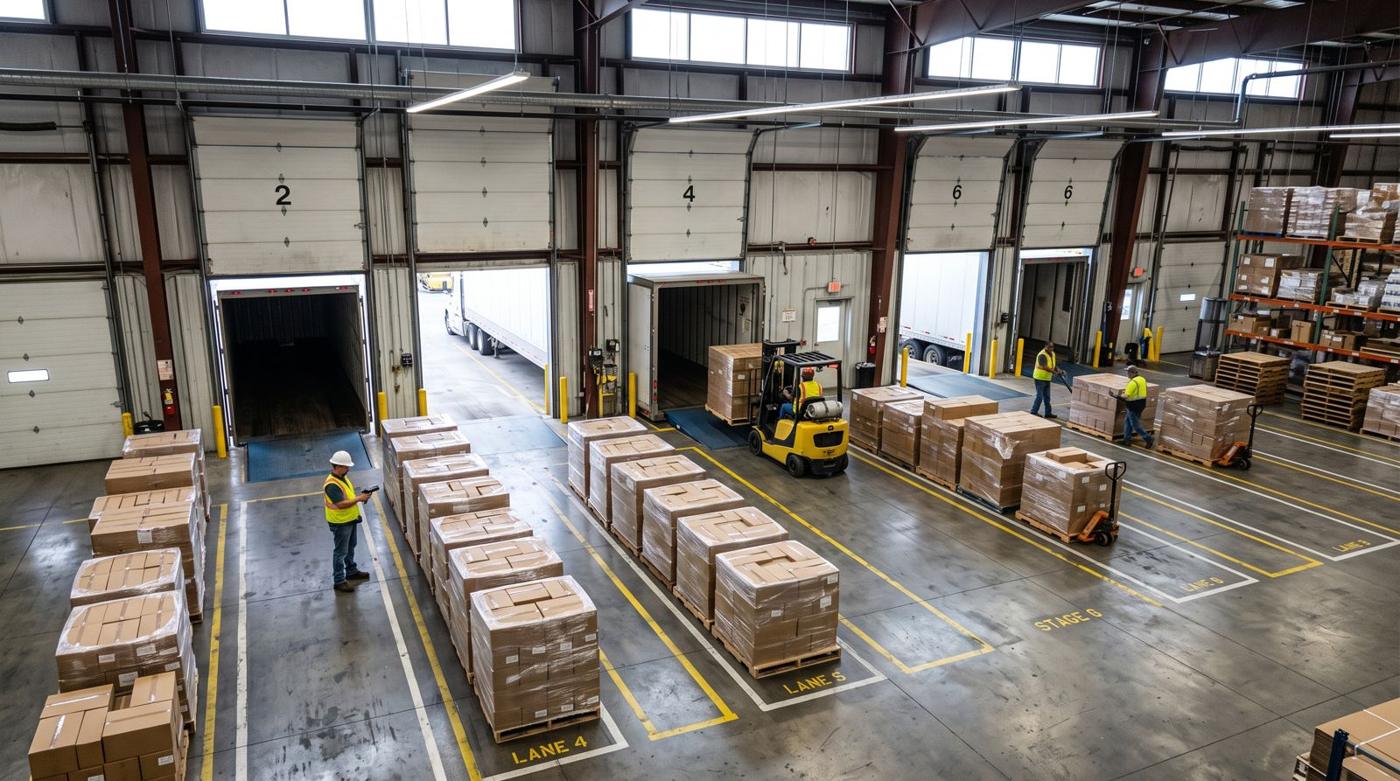
        Shipping dock with trailers at open doors and pallets staged in marked lanes

        Warehouses and docks

        • Door occupancy and trailer dwell
        • Staging lanes filled and cleared
        • Forklift utilization
        • Pallets in and out

        51 applications on the same cameras

        The three most requested in each group first. Each is a rule on a camera view, and a feasibility study shows which work on yours.
        Equipment and uptime

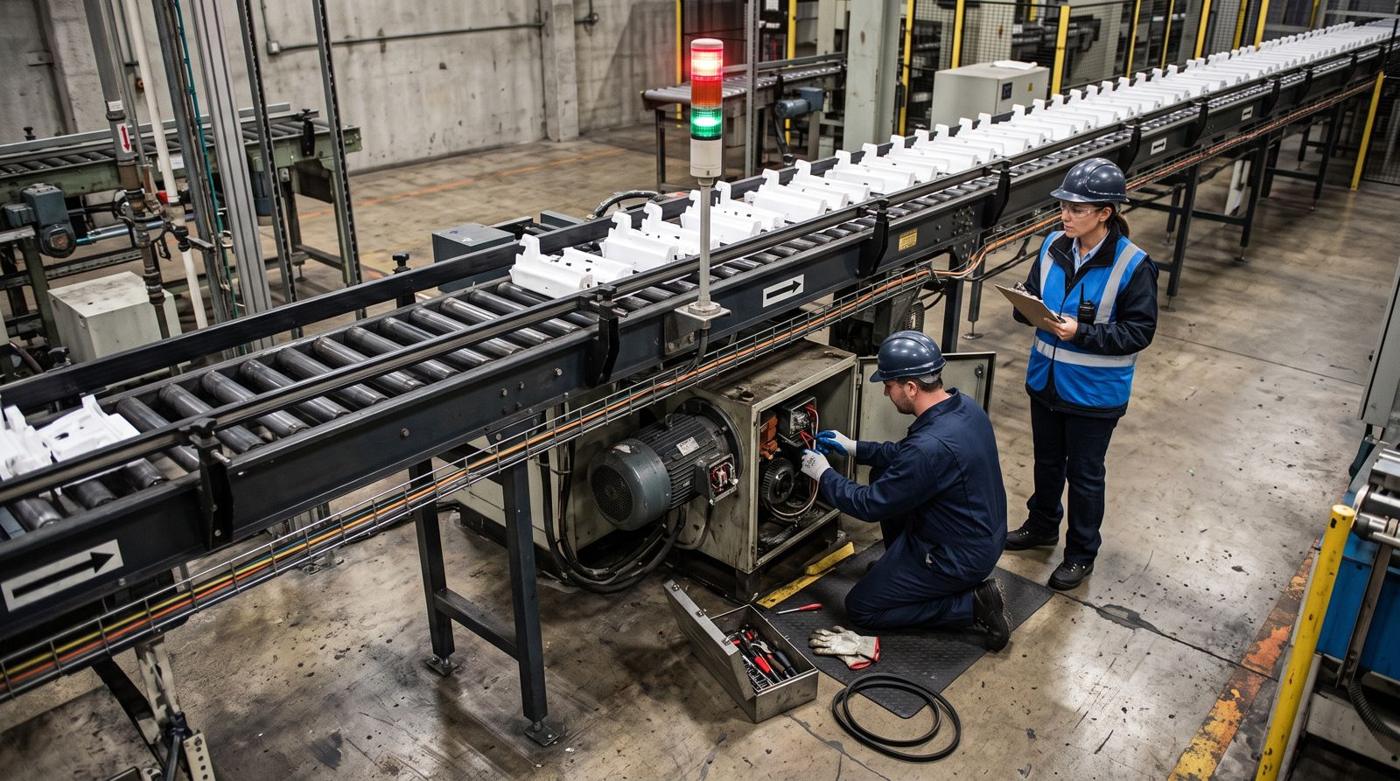
        A technician repairing a stopped conveyor motor while a supervisor watches
        Machine stateRunning, idle or down from stack lights, doors and motion, on any machine
        Downtime with the clipStart, end, duration and a reason picked from the footage
        Changeover timeFrom the last good part to the first good part, every time
        AlsoShort stopsPlanned vs unplanned stopsMaintenance response timeAndon and stack-light logConveyor jams and blockagesStarved and blocked machinesCrane and hoist useAnalog gauge reading

        Process and assembly

        An operator fitting a control panel on a generator set at station 4
        Step verificationEach step at each station confirmed before the unit moves on
        Cycle time by stationPer unit and per step, against takt
        Bottleneck finderThe station that sets the pace, and how often it's over takt
        AlsoOut-of-sequence stepsUnits in and out per stationKit completenessStandard work adherenceRework loopFirst-pass yieldBatch and stage timingLine start-up and shift ramp

        People and labor

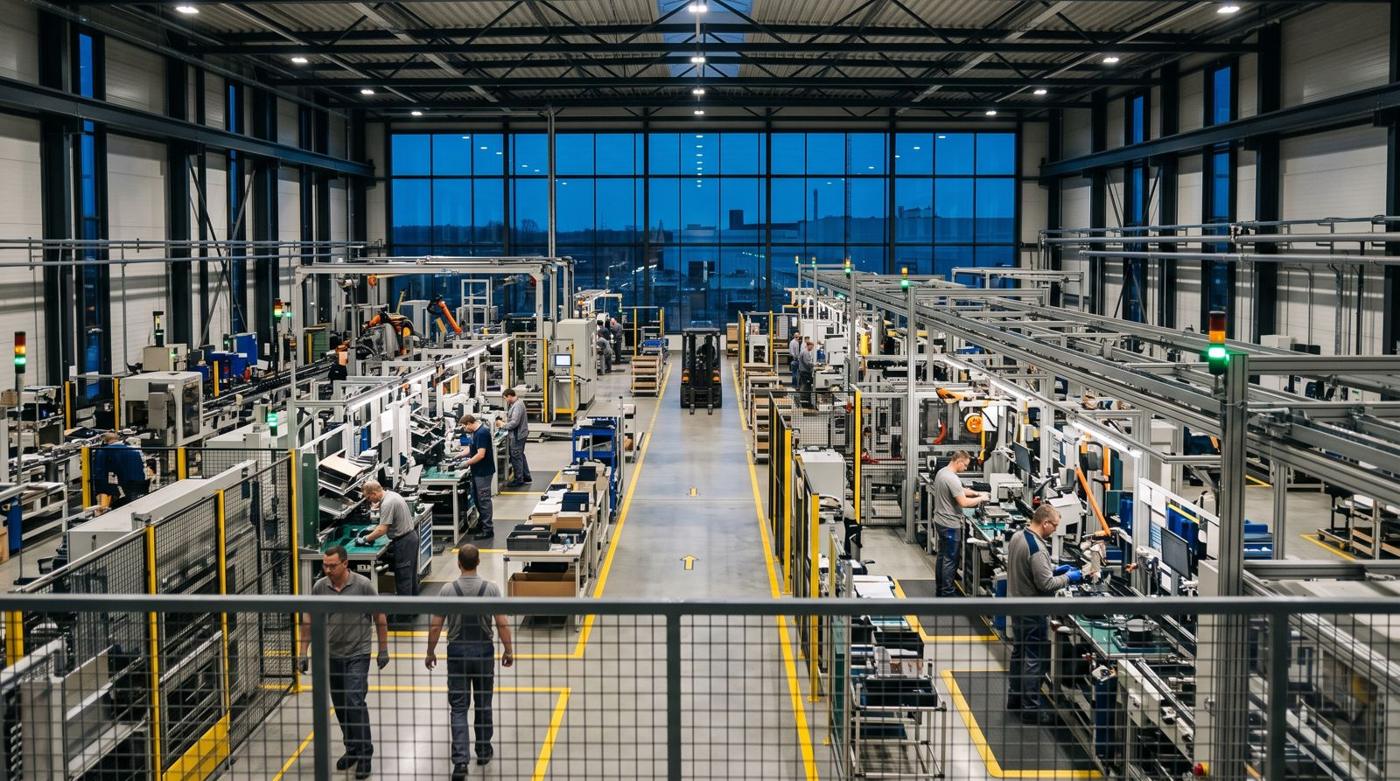
        Workers at assembly stations seen from a mezzanine
        Station staffed or emptyCoverage by station and shift, including breaks
        Working vs waitingWhere people wait on parts, machines or instructions
        Headcount by areaPeople in each area against the staffing plan
        AlsoWalking and searching timeAutomatic spaghetti diagramsLine balance by laborShift handover gapsErgonomic strain (reach, bend, lift)Time studies from video

        Material and flow

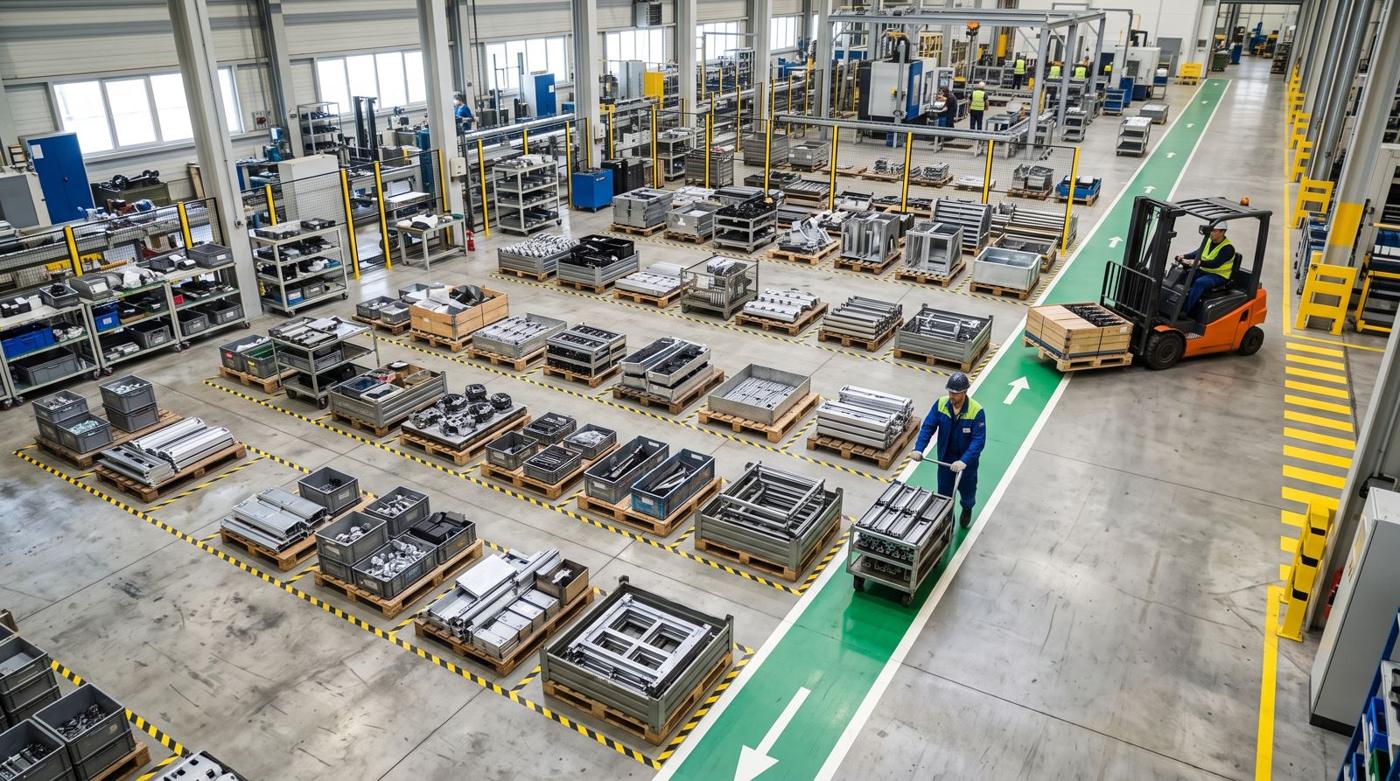
        WIP staging area with pallets in floor-marked squares and a forklift
        WIP and dwellHow much is waiting between stations, and for how long
        Line-side stockEmpty bins and short kits flagged before the station stops
        Dock doors and trailersDoor occupancy, trailer dwell and load time
        AlsoPallet location by zoneForklift loaded vs empty travelTugger route timingStaging squares full or blockedFinished goods vs ship planFloor space useReceiving to put-away time

        Quality, safety and 5S

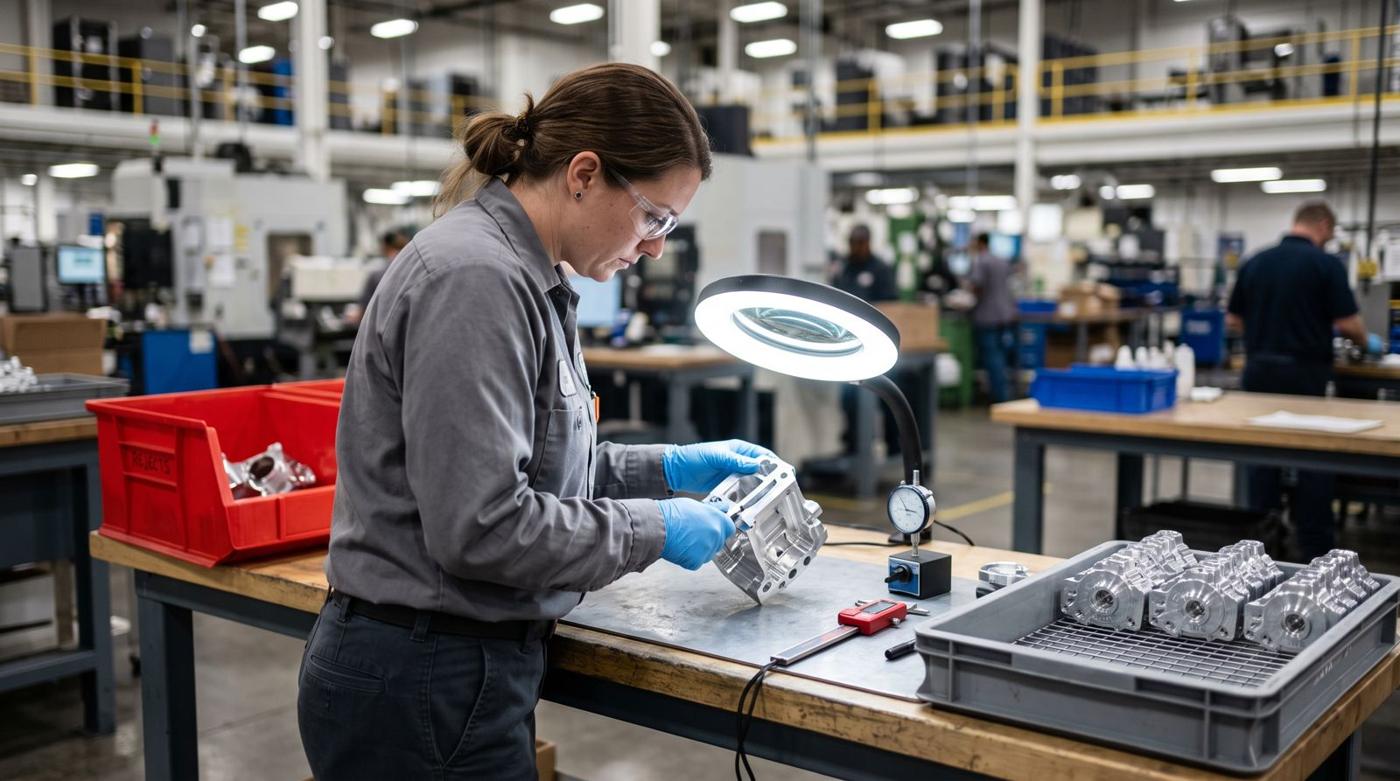
        An inspector checking a machined part under a ring light
        Visual checksParts present, oriented and labeled; visible defects at the station
        Reject countsUnits into the reject bin or rework bay, by station and shift
        Blocked aisles and exitsPallets and carts left where they shouldn't be
        AlsoLabel and packaging checksForeign objects on the lineForklift and pedestrian near missesRestricted zonesPPESpills on the floorTools returned, areas clear

        Downtime is expensive, a few OEE points add millions in capacity, and half of smaller plants still run on paper

        $1.4T

        A year lost to unplanned downtime by the world's 500 largest companies, about 11% of their revenue, by Siemens' estimate1

        Siemens, True Cost of Downtime 2024
        $150K

        What one hour of unplanned downtime can cost a small or mid-sized manufacturer, at the top end1

        Siemens, True Cost of Downtime 2024
        +10%

        More good output from the same line and planned hours when OEE rises 6 points, from a typical 60% to 66%. On a $50M line, that's up to $5M a year of added capacity2

        Illustrative; assumes the line is the constraint
        54%

        Of small and mid-sized plants still track production on paper or spreadsheets. Agnify records that data from your cameras and can feed it into your MES or spreadsheets3

        IoT Analytics, MES Market Report, 2025

        Start with your existing cameras and add one where a station needs it

        No rip and replace. Agnify connects to the feeds you already record, and a camera goes over each station where step checks matter.

        STEP 1

        Connect the views

        RTSP streams, your NVR or recorded footage. We map each camera to the lines, stations, zones and doors it sees.

        STEP 2

        We build it around your process

        Our engineers map your stations, steps, machine states and staging areas, then build and test the detection on your own footage before it goes live.

        STEP 3

        Run the floor on it

        Dashboards by line and shift, alerts with the frame to the people who own them, reports and events through the API.

        Cloud by default

        Nothing to host. Results arrive within minutes, which suits dashboards, shift reports and trend alerts.

        Real time on site

        For applications that need it, like holding a unit at a station or flagging a machine stop as it happens, Agnify runs on a server next to your cameras.

        Alongside your MES

        Events and counts go out through the API to your MES, BI or historian. Integrations are scoped per site.

        From your footage to a working result in two weeks

        A free feasibility study on one line, cell or dock, with an agreed end date and no commitment. We reply within one business day.

        1. You send a few hours of footage, or camera accessPick the line, machine or station you'd most like to understand.
        2. We come back with a written resultWhat we can measure on your cameras, how reliably, and what the first dashboard would show.
        3. If it's useful, we scope a pilot togetherOne use case, live on your cameras, judged against criteria agreed up front.

        Questions about cameras, privacy or IT? Read the FAQ

        Or email info@agnify.ai