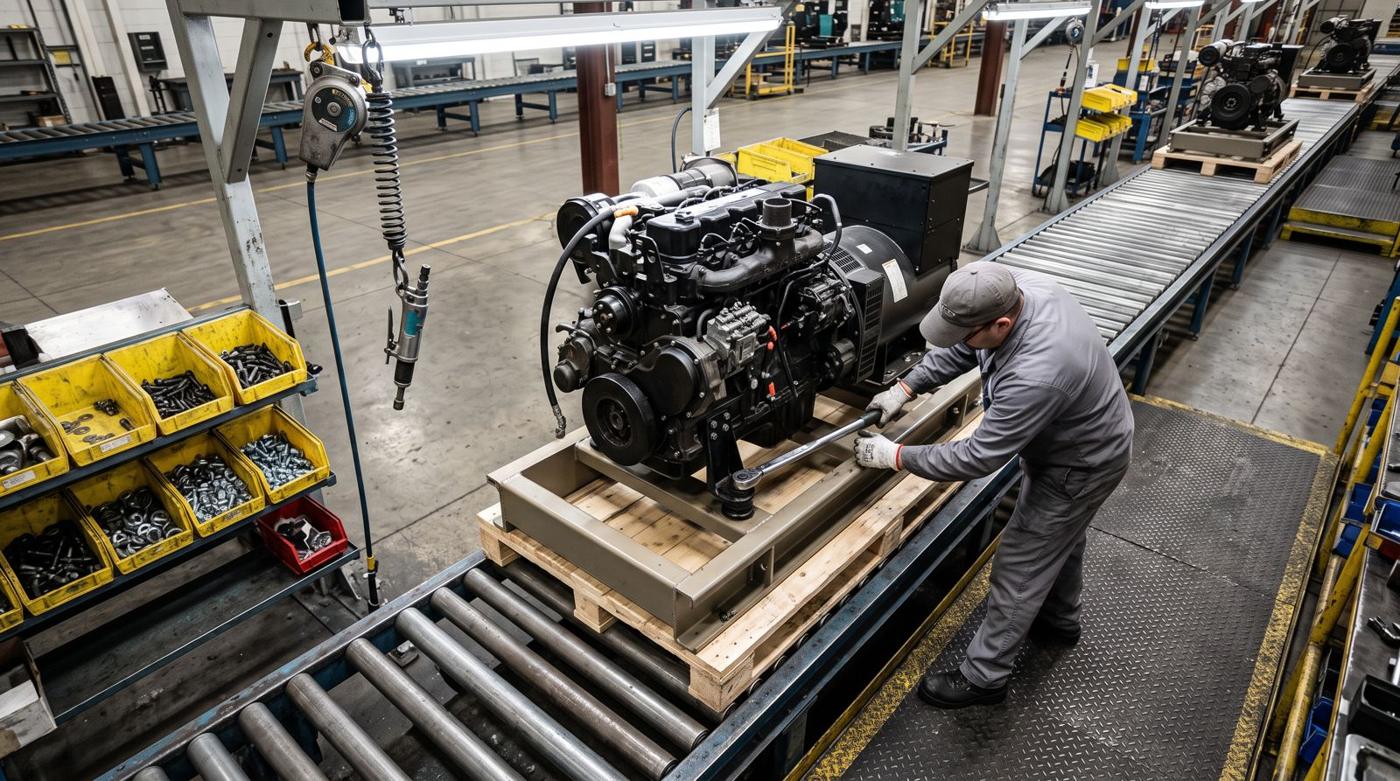
 Generated illustration
Assembly lines
- Step checks at each station
- Cycle time against takt
- Stations staffed or empty
- Rework loop and first-pass yield
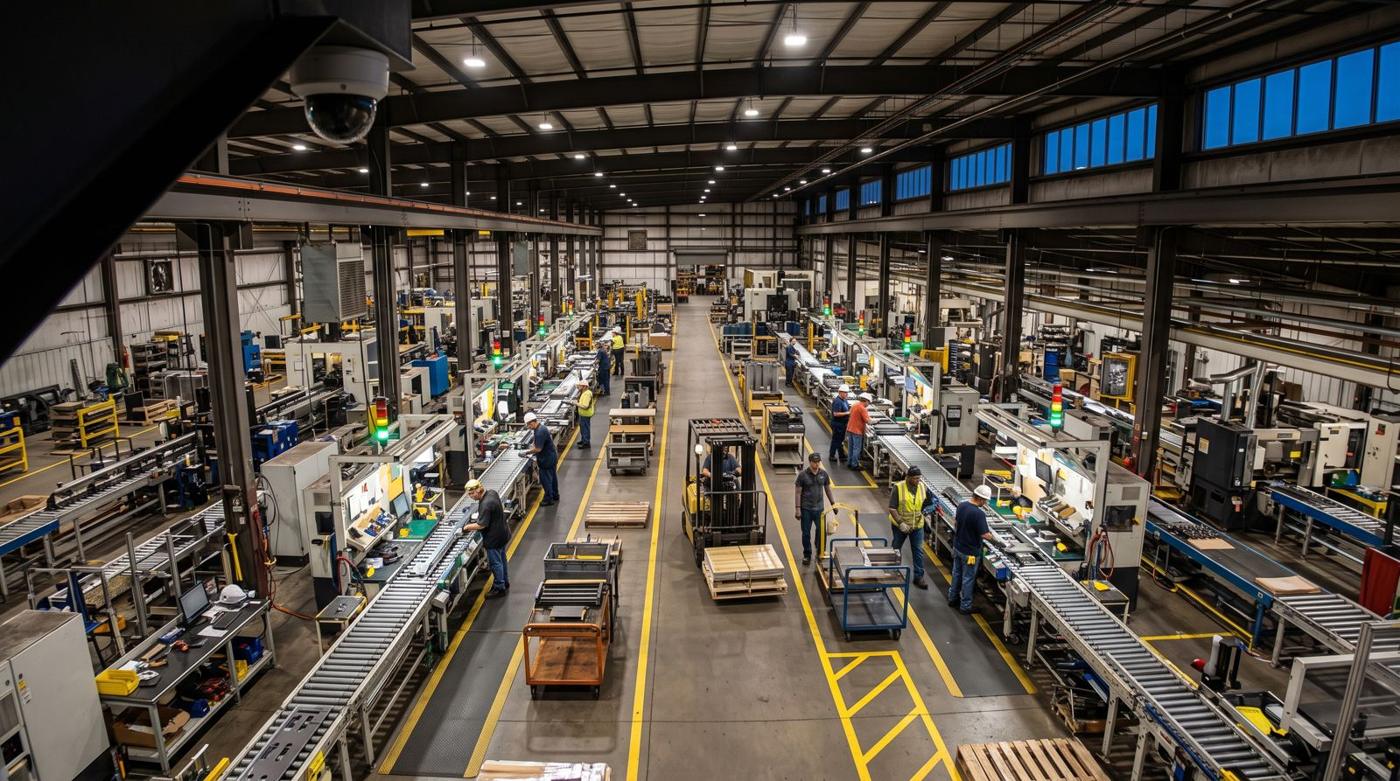
Agnify watches the cameras you already have, plus a camera over any station that needs one. It measures machine uptime and downtime, cycle time by station, missed assembly steps and material moving through the plant, by shift, line and site, without a clipboard.
A year lost to unplanned downtime by the world's 500 largest companies, about 11% of their revenue, by Siemens' estimate1
Siemens, True Cost of Downtime 2024What one hour of unplanned downtime can cost a small or mid-sized manufacturer, at the top end1
Siemens, True Cost of Downtime 2024More good output from the same line and planned hours when OEE rises 6 points, from a typical 60% to 66%. On a $50M line, that's up to $5M a year of added capacity2
Illustrative; assumes the line is the constraintOf small and mid-sized plants still track production on paper or spreadsheets. Agnify records that data from your cameras and can feed it into your MES or spreadsheets3
IoT Analytics, MES Market Report, 2025PLCs see the machines that are wired up. Your MES sees the scans. Everything in between is written down at the end of the shift, if at all. Cameras already see all of it.
Downtime is logged from memory, and manual logs are "often highly inaccurate." Short stops disappear from the record altogether.4
01 · Equipment →Nothing records the bolt, the connector or the label that a person fits by hand, until a unit fails later.
02 · Process →The staffing plan says one thing. The floor says another, and walking, waiting and searching never show up anywhere.
03 · People →A pallet is scanned in and scanned out. How long it waited, and where, stays invisible.
04 · Material →Running, idle or down, read from the stack light, the door, the spindle or the parts coming out. That works on older machines with no data connection too. Every stop gets a start, an end, a duration and the clip, so the reason comes from a look at the clip, not a guess.
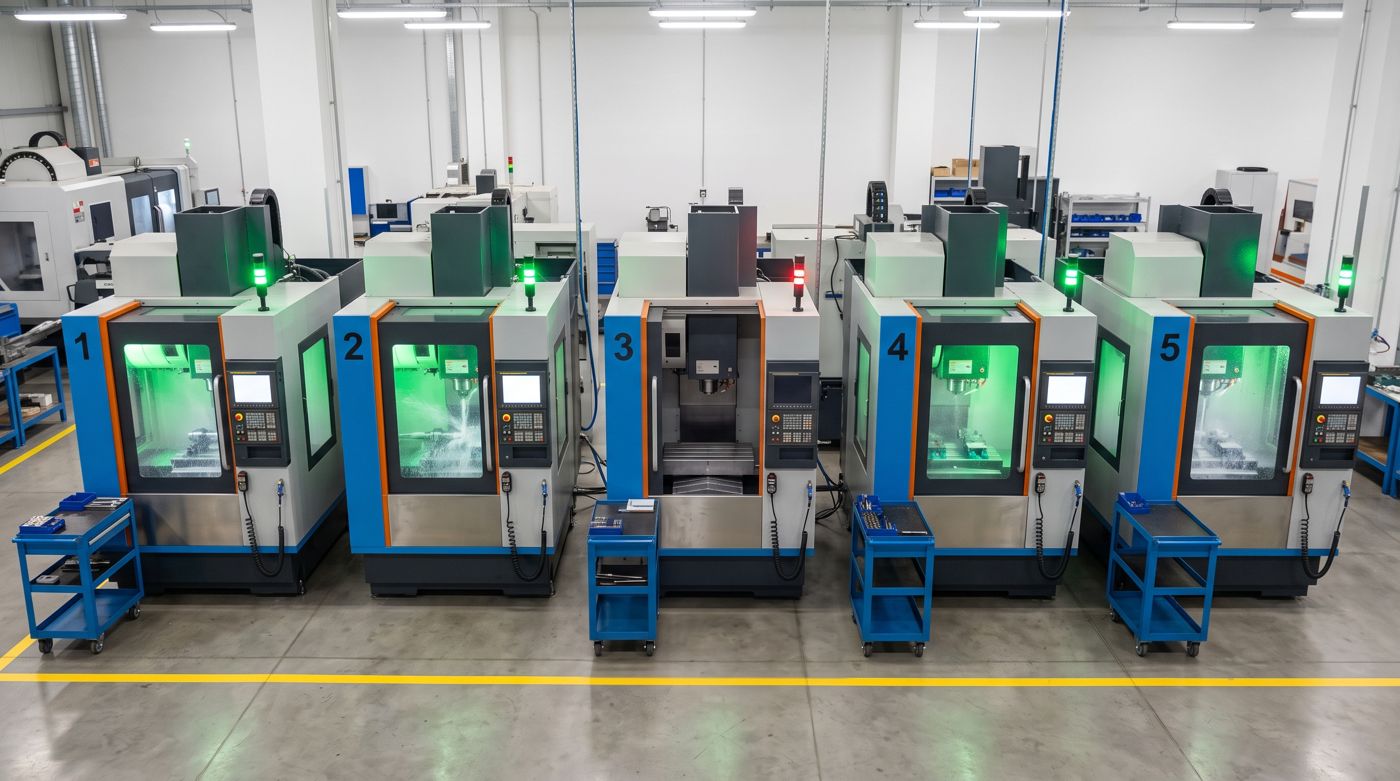
Boxes, states and timelines are an illustration with example data, not model output.
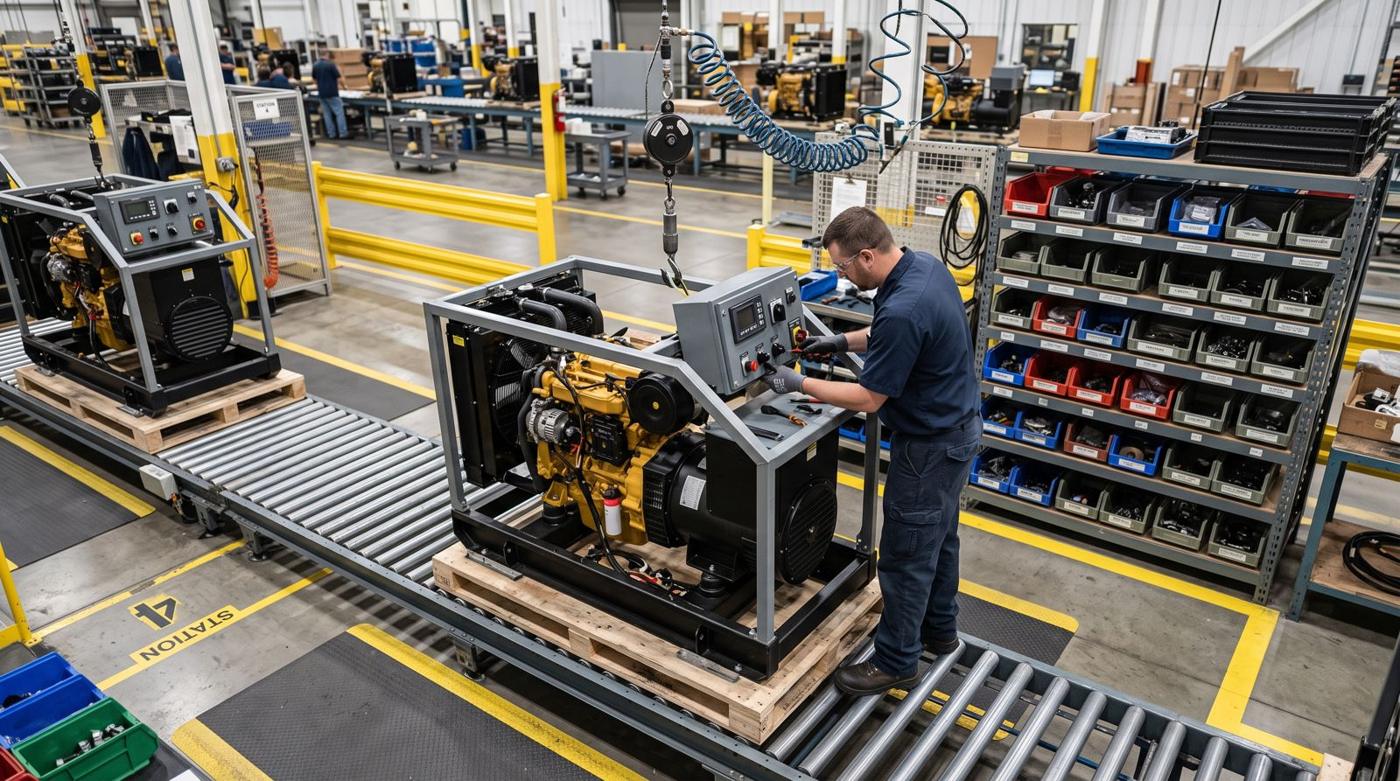
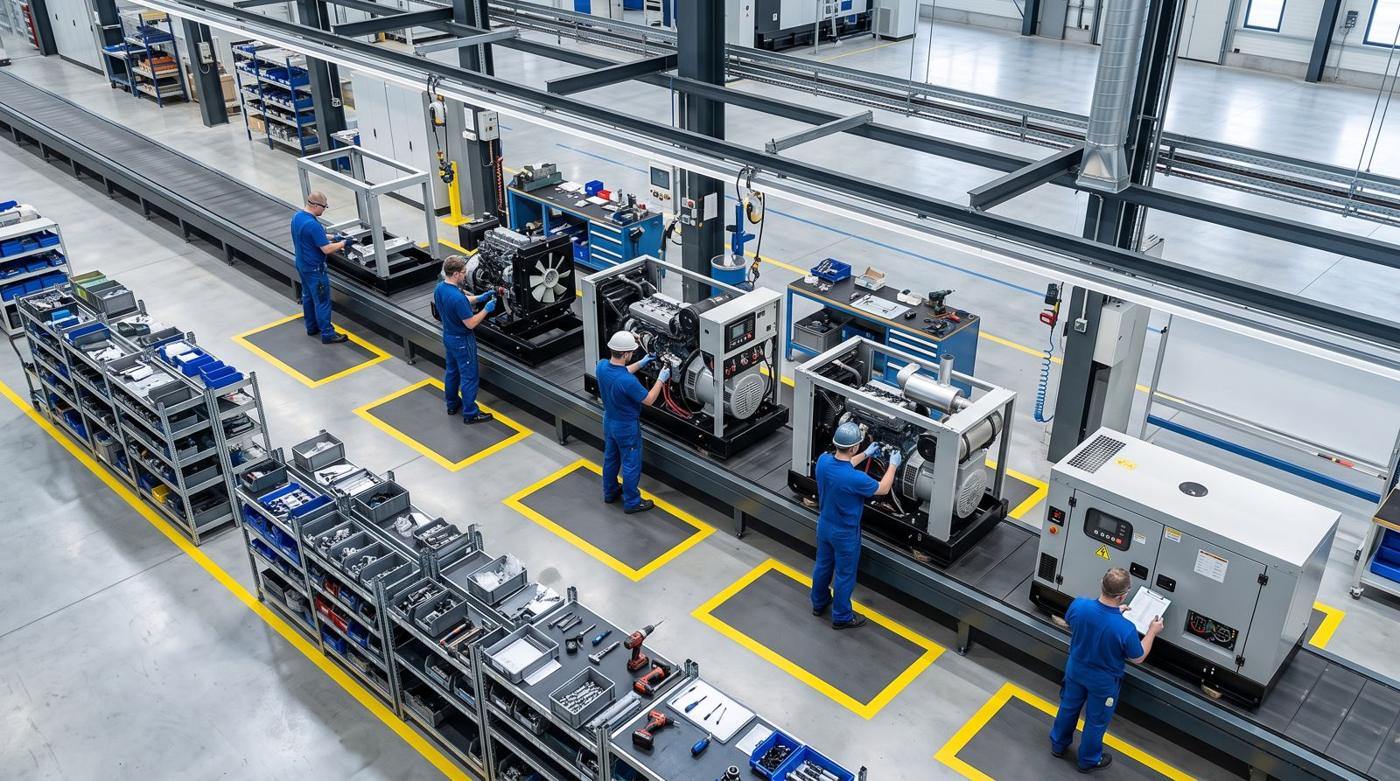
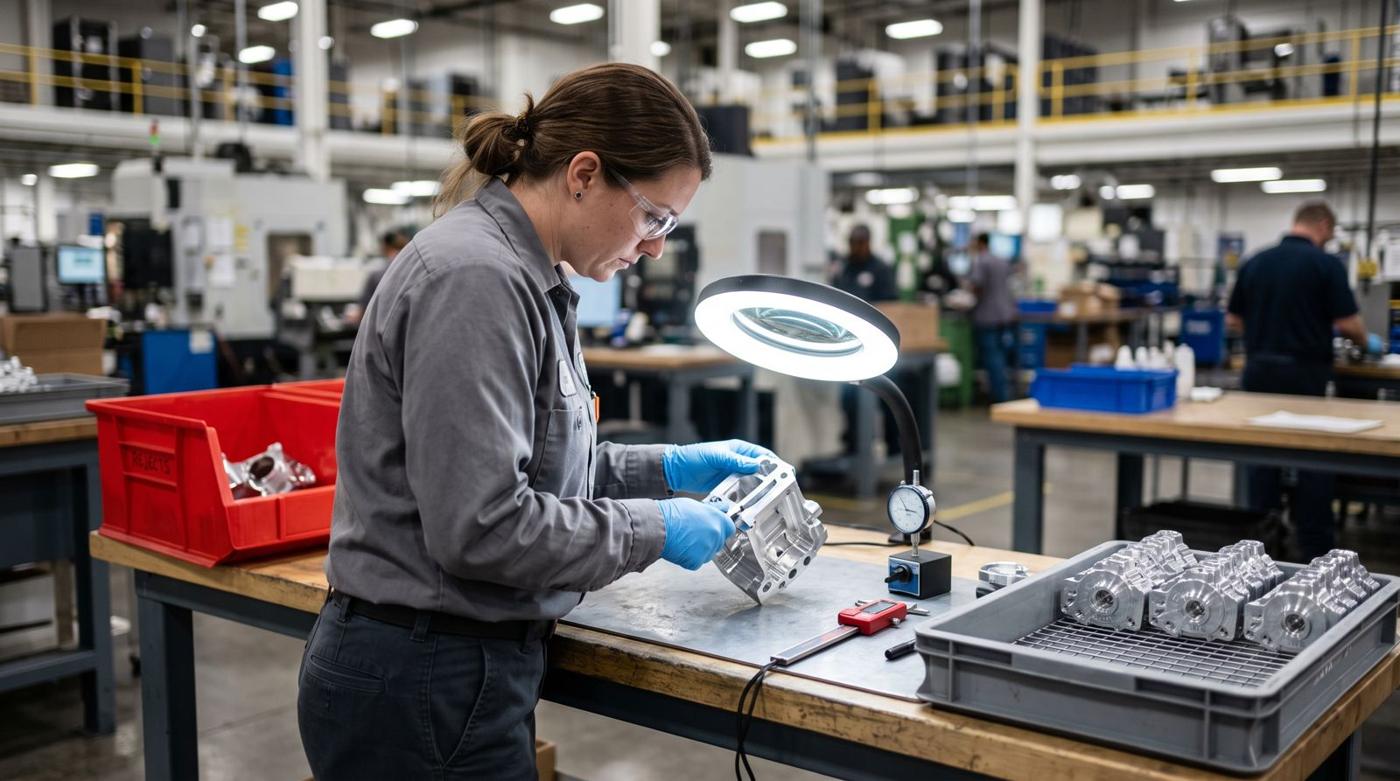
A camera over each station confirms the step happened before the unit moves on: part present, fastened, guard fitted, label on. Missed and out-of-order steps are flagged at the station, not at final inspection. The same cameras time each stage, so you can see where the line is really constrained.
Median minutes per unit · generator line · last 20 units · example data
Station 3 is the constraint: over takt on 14 of the last 20 units. Hover a bar for details.
 Generated illustration
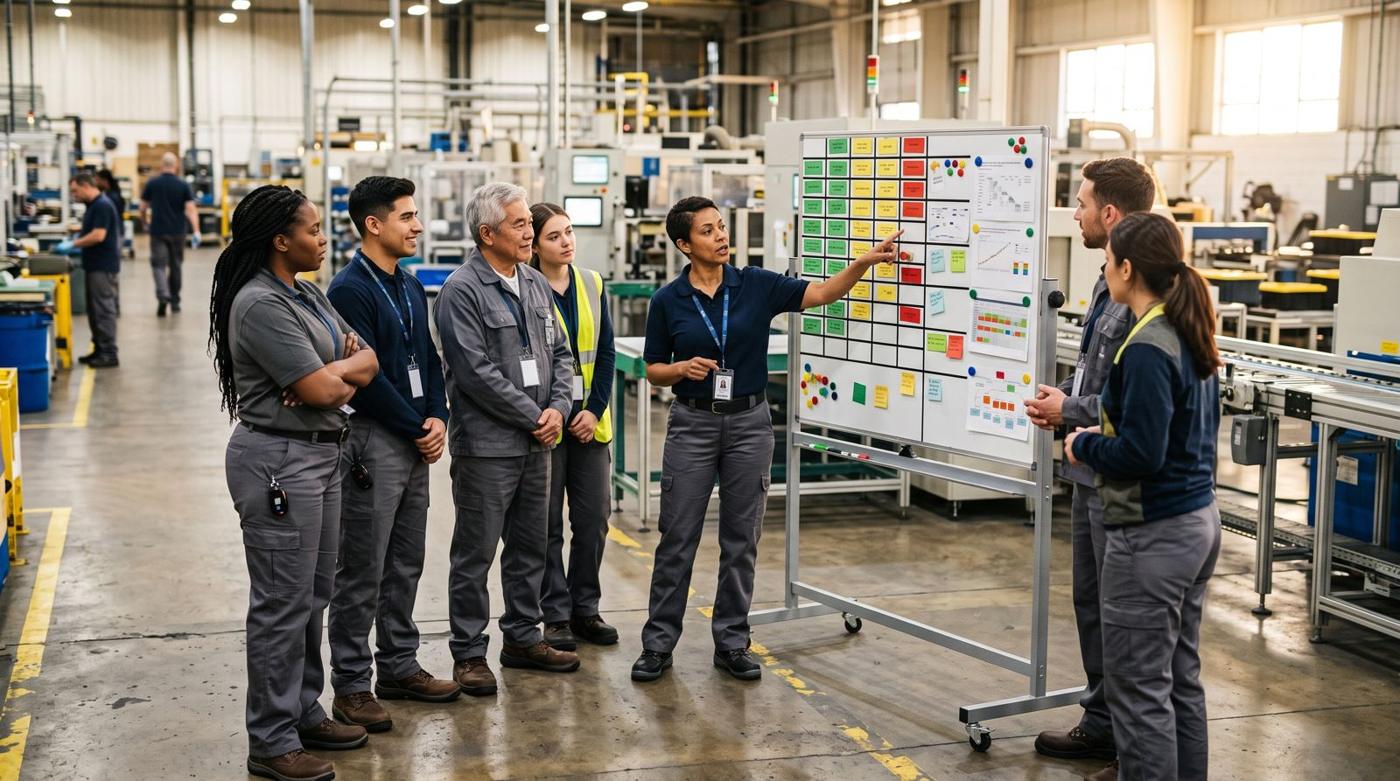
Shows which stations are staffed or empty, time spent working versus waiting, headcount by area against plan, and the walking and searching that never makes it into a time study. With up to 1.9 million US manufacturing jobs at risk of going unfilled by 2033, every staffed hour counts.6 It's built to help teams balance work, not to watch individuals.
Share of staffed time · example data
Activity, not identity. Agnify reports by station, zone, role and shift. It uses no facial recognition, whole-person blur can be switched on for video outputs, and retention is set to the shortest period the purpose needs. We help you brief your teams and, where one exists, the works council or union before anything goes live.
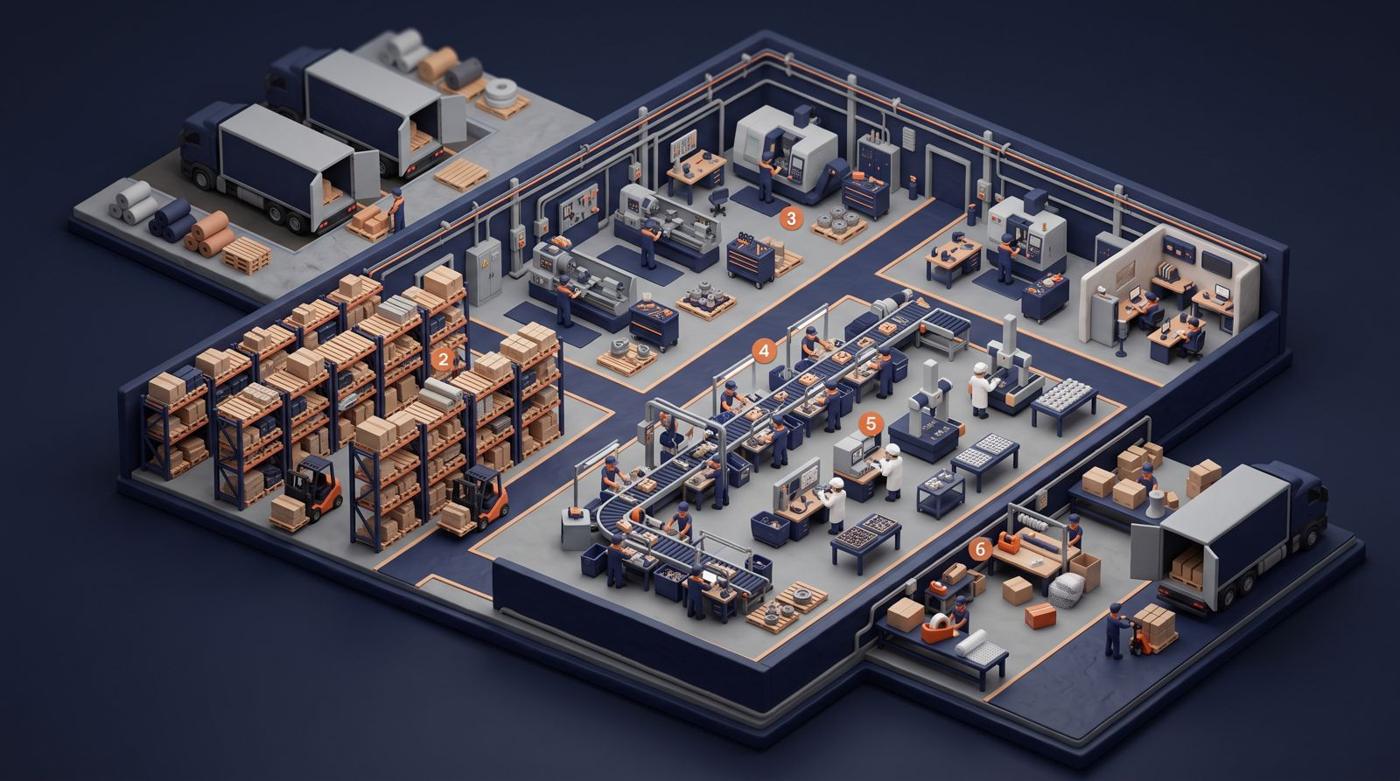
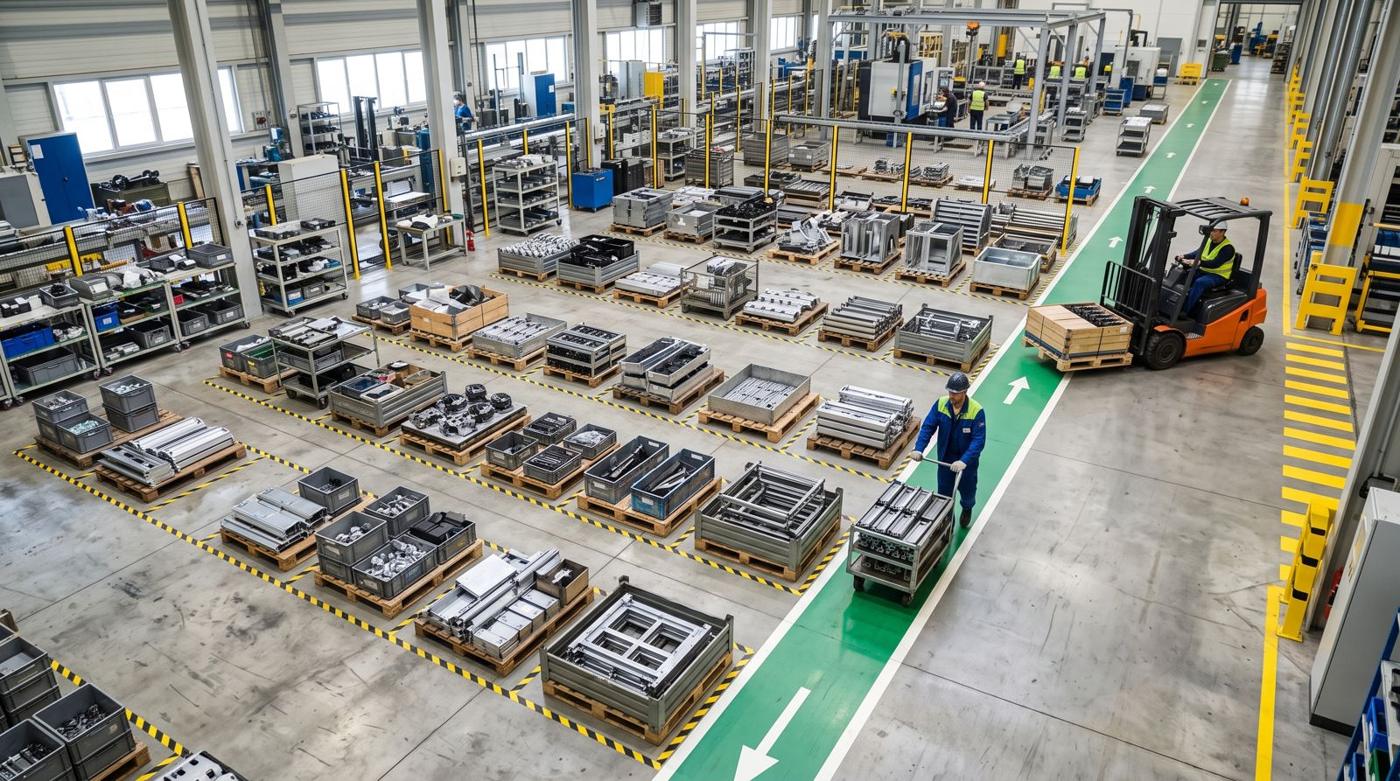
Follow pallets, carts and WIP from receiving through production to shipping. You'll see where work in progress piles up, how long it waits between stations, which dock doors are busy and how forklifts spend their time. A plant's flow map, drawn from what really happened.
Receiving to shipping, median, last 7 days · example data
Value-added time is the small slice. The rest is waiting, and waiting is where the space and cash go.
Availability comes from real stop times, performance from counted cycles and quality from rejects seen at the station. OEE per line and shift, broken into the losses your daily meeting can act on, and questions answered in plain English: "When did line 3 stop yesterday, and why?" Manufacturers investing in smart manufacturing report 10–15% of capacity unlocked.7
Example data
 Generated illustration
With the same planned hours and product mix, good output rises in proportion to OEE. Put in your own numbers.
Illustrative arithmetic, not a measured or guaranteed result. Assumes this line is the plant's constraint, with the same product mix, ideal cycle time and planned hours. Added capacity becomes revenue only where there's demand; otherwise it's the same volume in fewer hours.
Agnify is built around what operations teams measure, not around one industry. Here's how it reads on four kinds of floor.
Generated illustration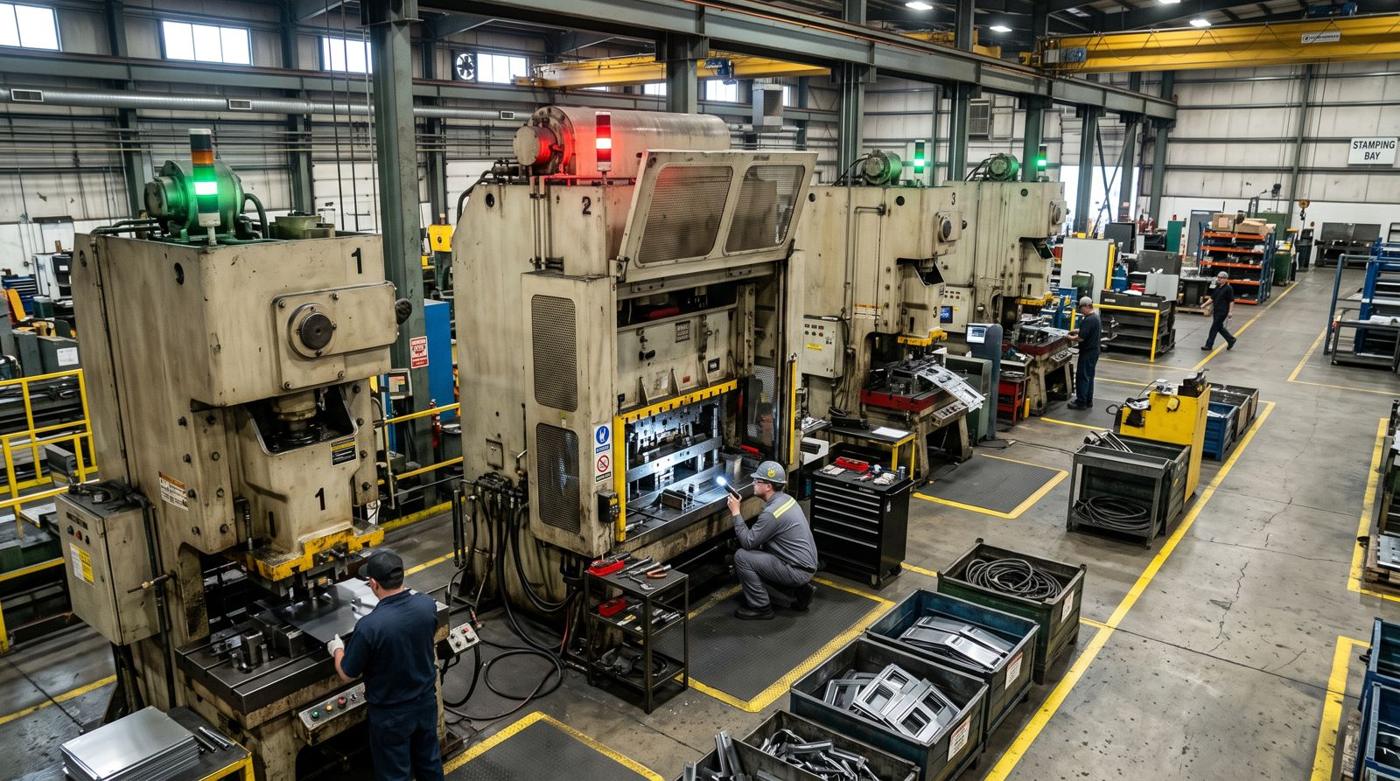 Generated illustration
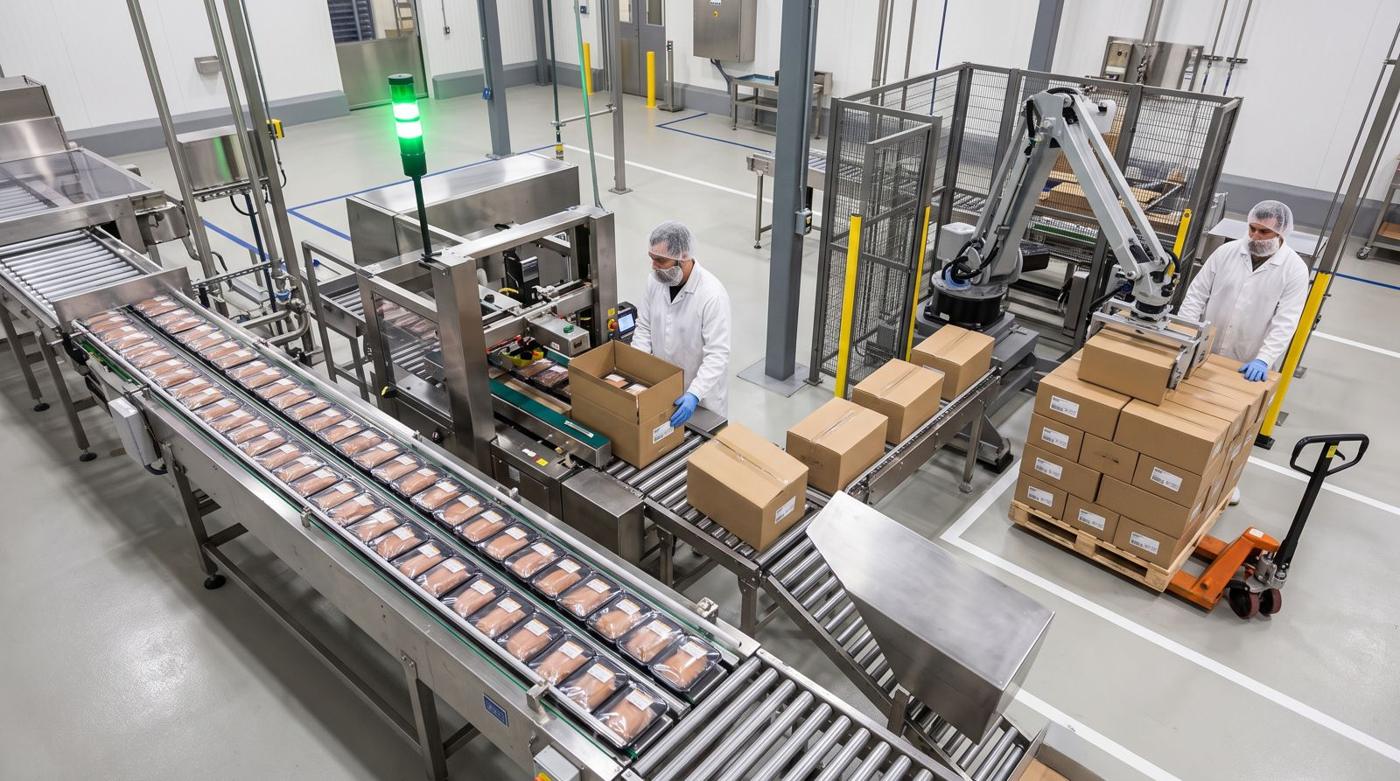 Generated illustration
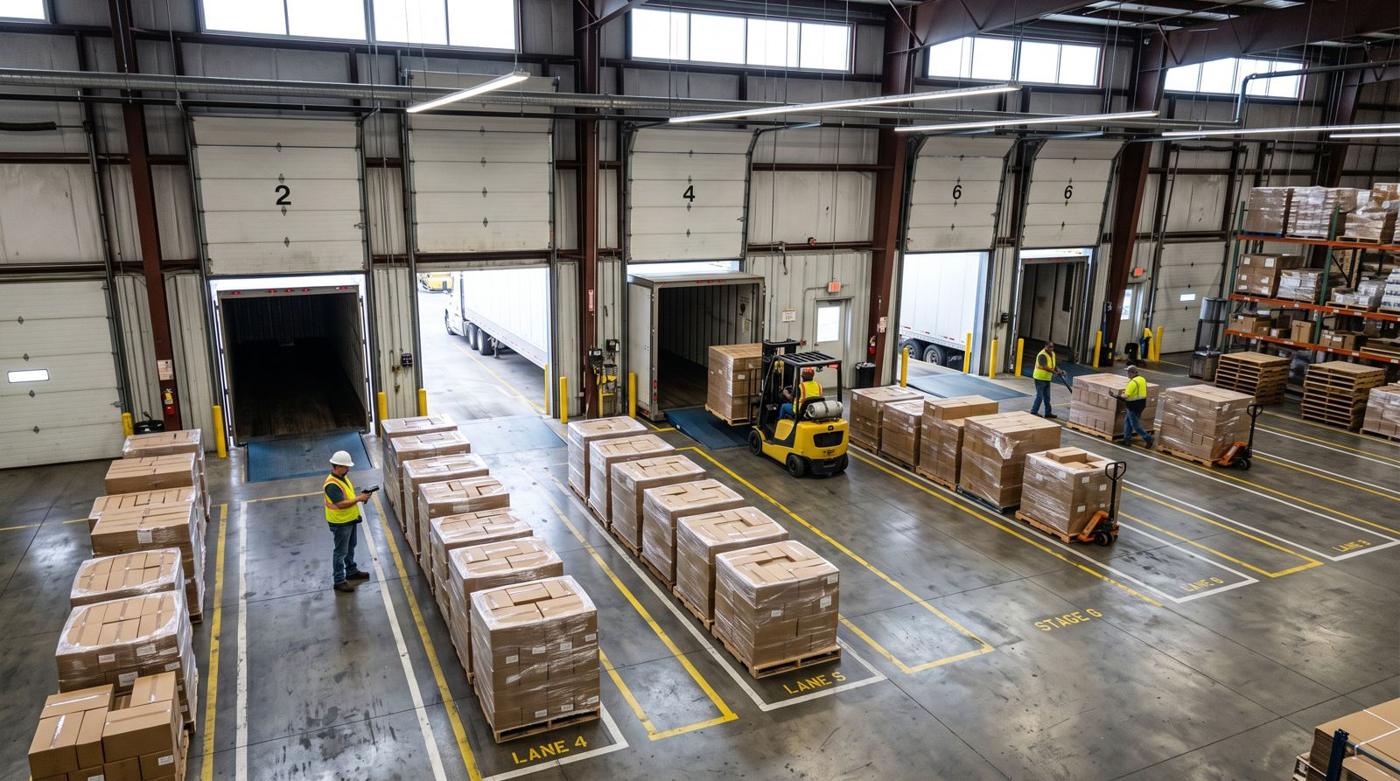 Generated illustration
The three most requested in each group first. Each is a rule on a camera view, and a feasibility study shows which work on yours.
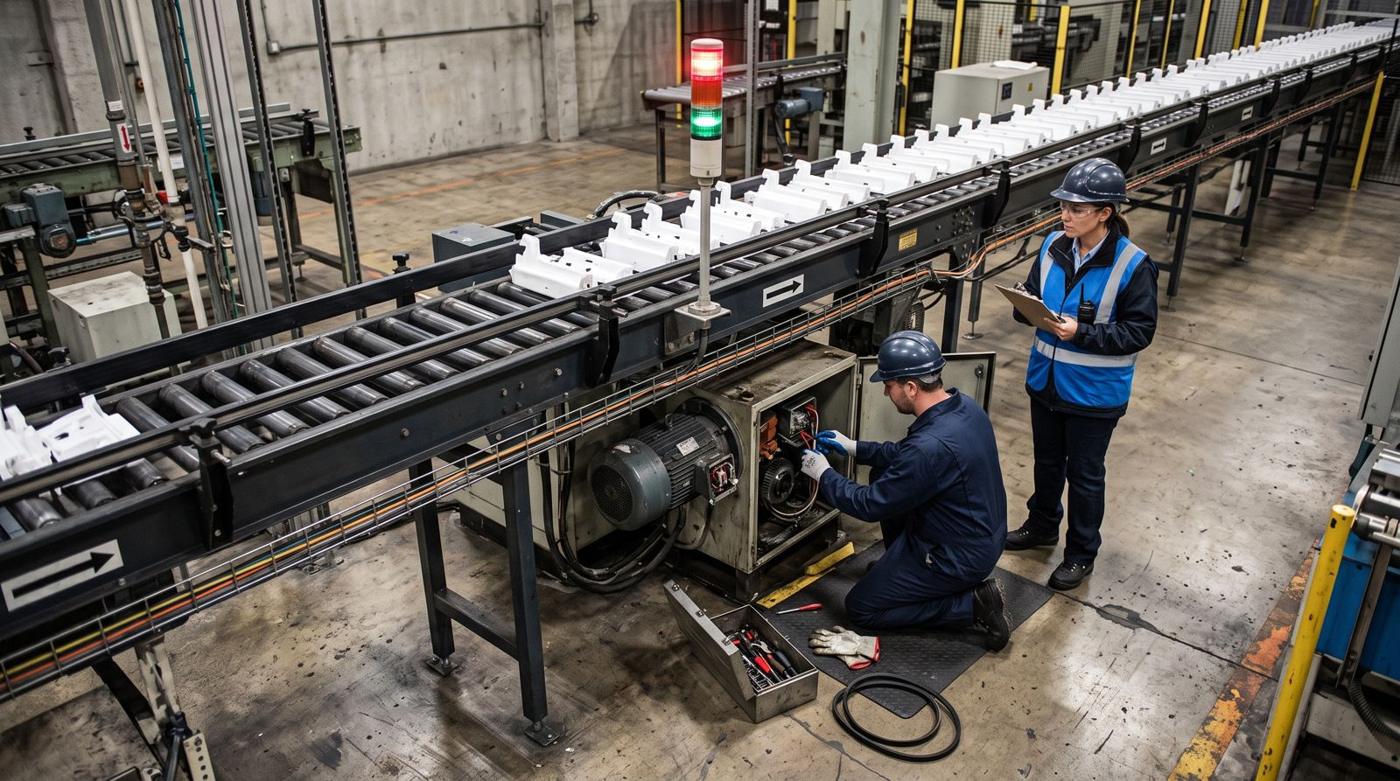 Generated illustrationGenerated illustration
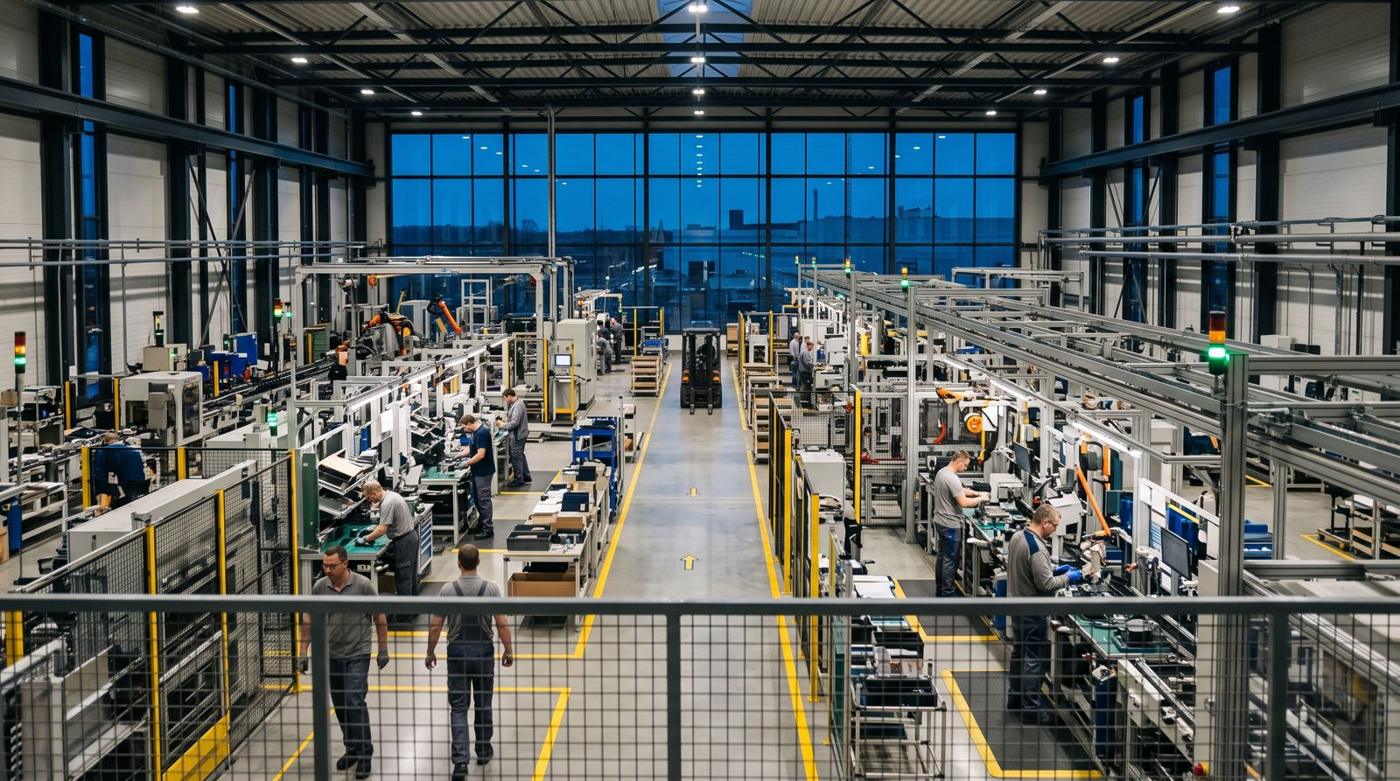 Generated illustration
 Generated illustration
 Generated illustration
No rip and replace. Agnify connects to the feeds you already record, and a camera goes over each station where step checks matter.
RTSP streams, your NVR or recorded footage. We map each camera to the lines, stations, zones and doors it sees.
Our engineers map your stations, steps, machine states and staging areas, then build and test the detection on your own footage before it goes live.
Dashboards by line and shift, alerts with the frame to the people who own them, reports and events through the API.
Nothing to host. Results arrive within minutes, which suits dashboards, shift reports and trend alerts.
For applications that need it, like holding a unit at a station or flagging a machine stop as it happens, Agnify runs on a server next to your cameras.
Events and counts go out through the API to your MES, BI or historian. Integrations are scoped per site.
A free feasibility study on one line, cell or dock, with an agreed end date and no commitment.
For uptime, people and material flow, usually not: the cameras already covering the floor are often enough. For step checks at a manual station we suggest a camera mounted over that station, because a ceiling camera across the hall can't see a bolt or a connector. The feasibility study checks angles and resolution on the views you care about.
Machine signals tell you a machine stopped. The camera shows why, and covers what isn't wired: manual stations, older machines, material between scans and people. Agnify sends its events and counts to the systems you already use, so the camera fills the gaps rather than duplicating what you have.
Reports are by station, zone, role and shift, not by named person. There's no facial recognition, whole-person blur can be enabled for video outputs, and retention is kept short. We help you explain the purpose to your teams and consult the works council or union where one exists.
Yes, for the applications that need it. Step checks that hold a unit at the station, or alerts the moment a machine stops, run on a server on site next to the cameras. Dashboards and shift reports run in the cloud, where results arrive within minutes. Agnify signals and records; it isn't a certified safety system and doesn't replace machine guarding.
We measure it on your footage. The feasibility study and the pilot report results against events your team checks by hand, before anything scales.
Access to camera streams or an NVR export, and a network path out for cloud processing. Where an application needs real time, or video has to stay in the building, a server on site.
Tell us about your floor and what you want to measure. We'll reply within one business day with next steps for a feasibility study.
Images on this page are generated illustrations. Boxes, states, charts and events are example data for illustration only. Capabilities are offered as feasibility-study outcomes and are validated on your footage. Agnify is not a certified safety system and doesn't replace machine guarding.